If you have ever tried to map out your path to Financial Independence (FIRE) or simply wanted to see where your money goes every month, you have likely run into the “Telemetry Problem.”
To get good financial telemetry, you are usually forced to choose between two evils: paying a $10/month SaaS subscription to a cloud company that scrapes your bank data, or spending your weekends fighting with fragile, broken Excel formulas.
I wanted the powerful analytics of a modern Silicon Valley startup, but I demanded the privacy of a local-first system. I didn’t want my financial data sitting on someone else’s server, and I didn’t want to rely on third-party APIs that constantly break.
So, I built FinFortress – a 100% offline, Python-based personal finance dashboard powered by Streamlit.
Today, I’m opening the hood. Here is a step-by-step look at how FinFortress turns chaotic bank exports into a crystal-clear, automated roadmap to financial independence.
Step 1: The Input (Taming the CSV Monster)
The foundation of any good personal finance dashboard is clean data. But if you’ve ever downloaded a CSV export from a bank, you know it is the Wild West. Some use commas, some use semicolons, and the date formats are always different.
Instead of relying on fragile cloud APIs like Plaid to sync this data, FinFortress handles it locally.
How it works:
- You download your raw CSV export directly from your bank.
- You drop it into the FinFortress secure file uploader.
- The Python backend instantly standardizes the columns (
Date,Description,Amount), sanitizes the messy number formats, and merges it into your encrypted local database.
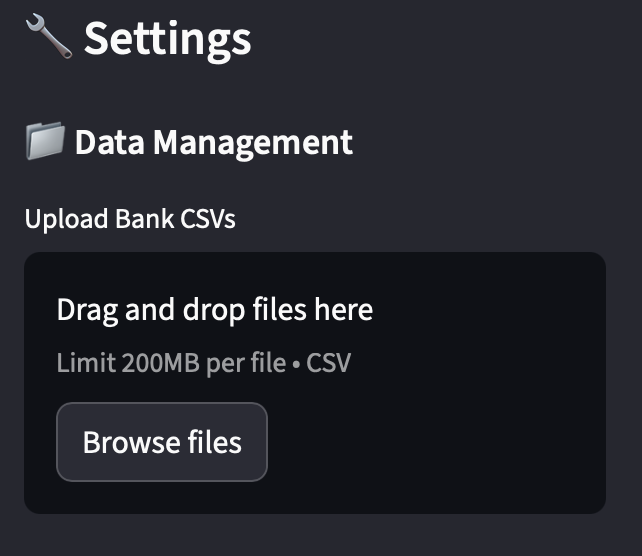
Because this happens entirely on your local machine, there is zero risk of a cloud data breach. Your raw financial history never touches the internet.
Step 2: The Engine (Training the Local AI Copilot)
Manual tagging is the enemy of consistency. If a budget tracker takes too much time to maintain, you will abandon it. Most cloud apps solve this with black-box algorithms that constantly miscategorize your local bakery as “Entertainment.”
FinFortress solves this using a local Machine Learning engine (LinearSVC) that learns your specific logic, running directly on your computer’s processor.
How to automate your workflow:
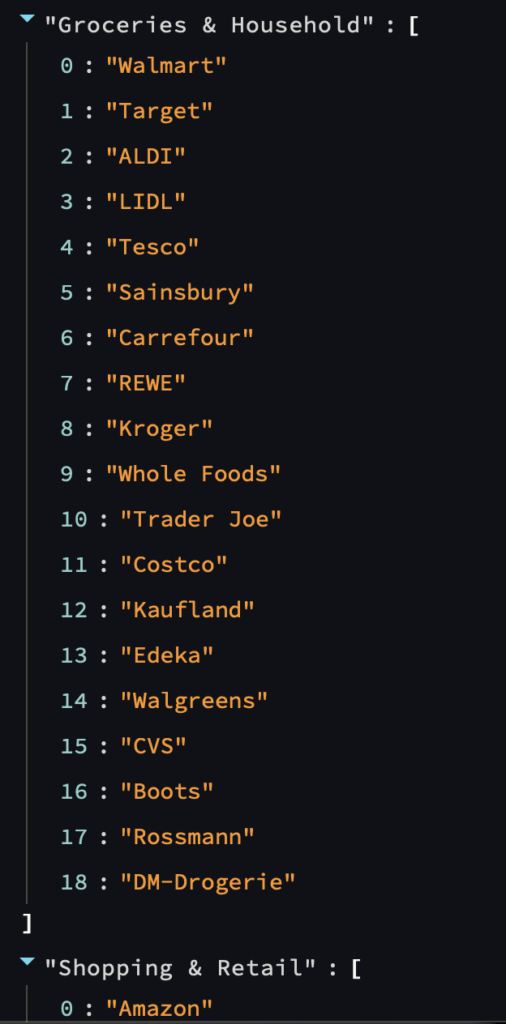
- The Pre-Flight Check: Before uploading data, you open the local
settings.yamlfile. Here, you define your custom categories and add a few of your most frequent merchants (e.g., mapping “Aldi” to Groceries or “Netflix” to Subscriptions). - The Baseline: When you upload your first file, you manually categorize about 20 to 30 unique transactions using simple dropdowns.
- The Magic Moment: Once the AI has this baseline, it activates. The next time you upload a bank file, the algorithm scans the text descriptions, recognizes your patterns, and automatically predicts the correct categories for new expenses.
You get a system that drastically speeds up your monthly workflow by automating the repetitive stuff, without a single byte of data leaving your hard drive.
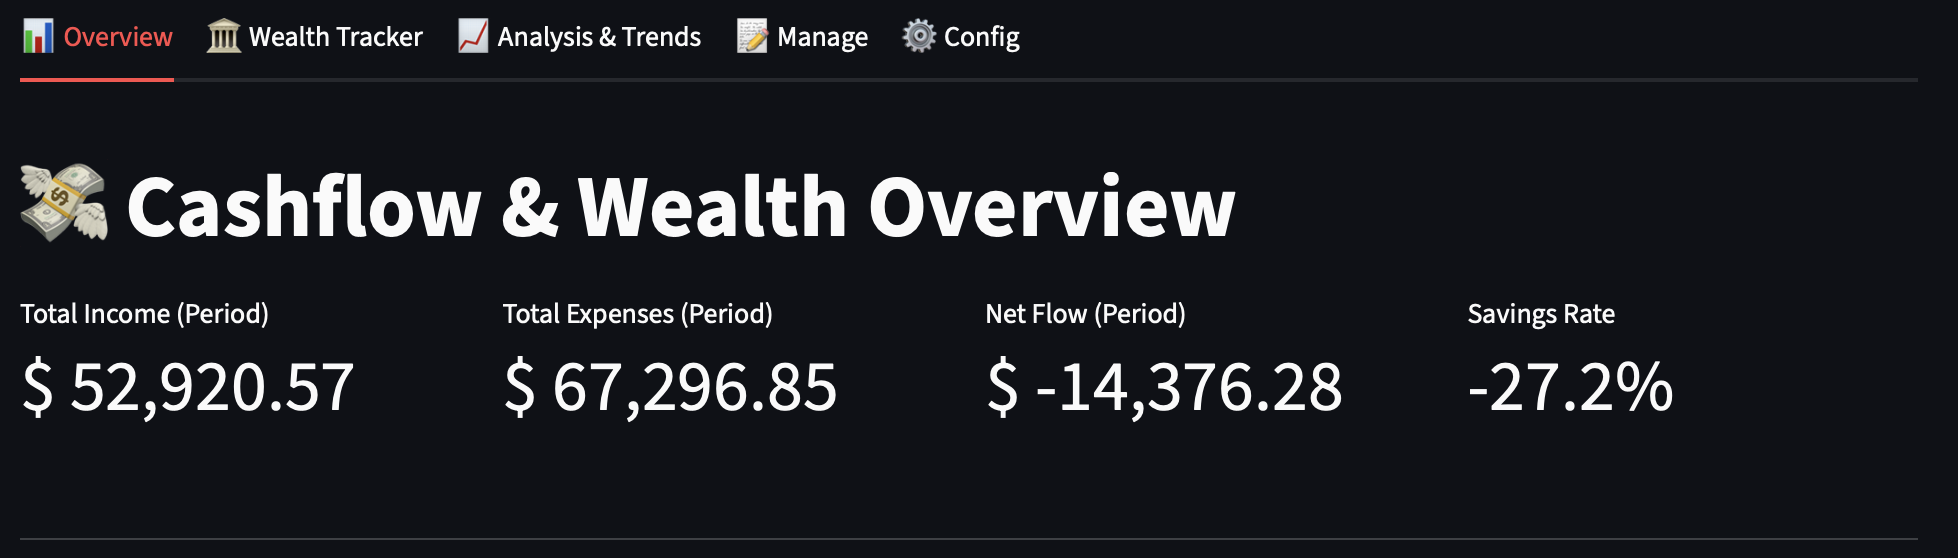
Step 3: The Flow (Visualizing Cash Velocity)
Pie charts are dead. They show you a static slice of your expenses, but they fail to show you the velocity of your money. To truly understand your cash flow, you need to see how it moves.
This is where the FinFortress Sankey Diagram comes in.
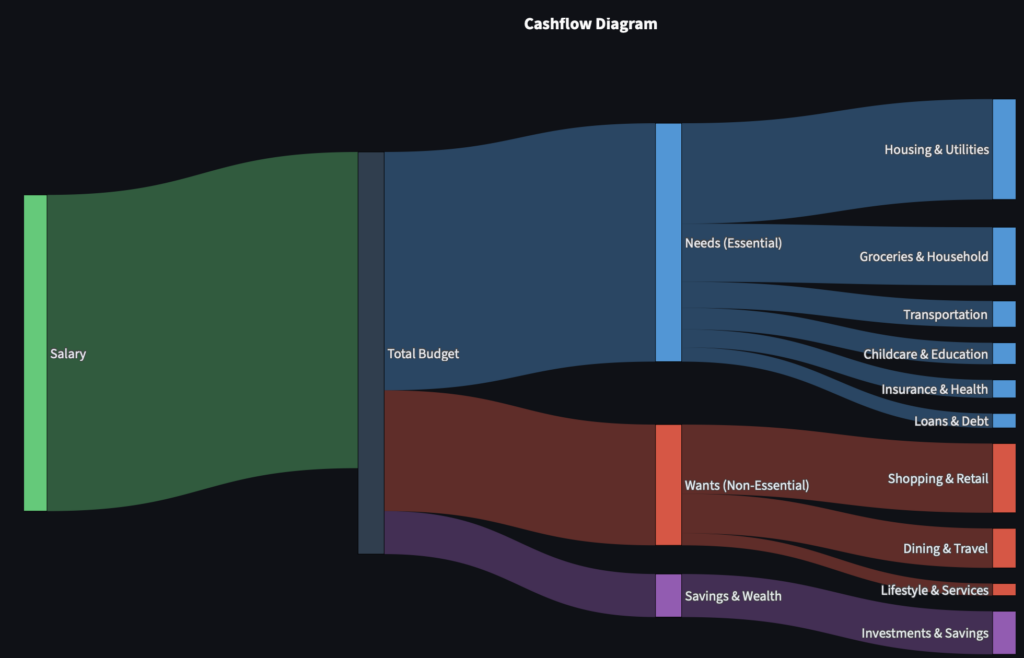
When you open the Overview Tab, FinFortress visually maps every penny entering and leaving your ecosystem. You can literally watch the thick stream of your Income split into distinct rivers:
- Needs (Essential): Housing, groceries, insurance.
- Wants (Non-Essential): Dining out, shopping, subscriptions.
- Savings & Wealth: Investments, debt paydown.
Seeing a thick line flowing into “Subscriptions” or “Dining Out” triggers an immediate psychological shift. It makes structural leaks in your budget instantly obvious, allowing you to course-correct before the month is over.
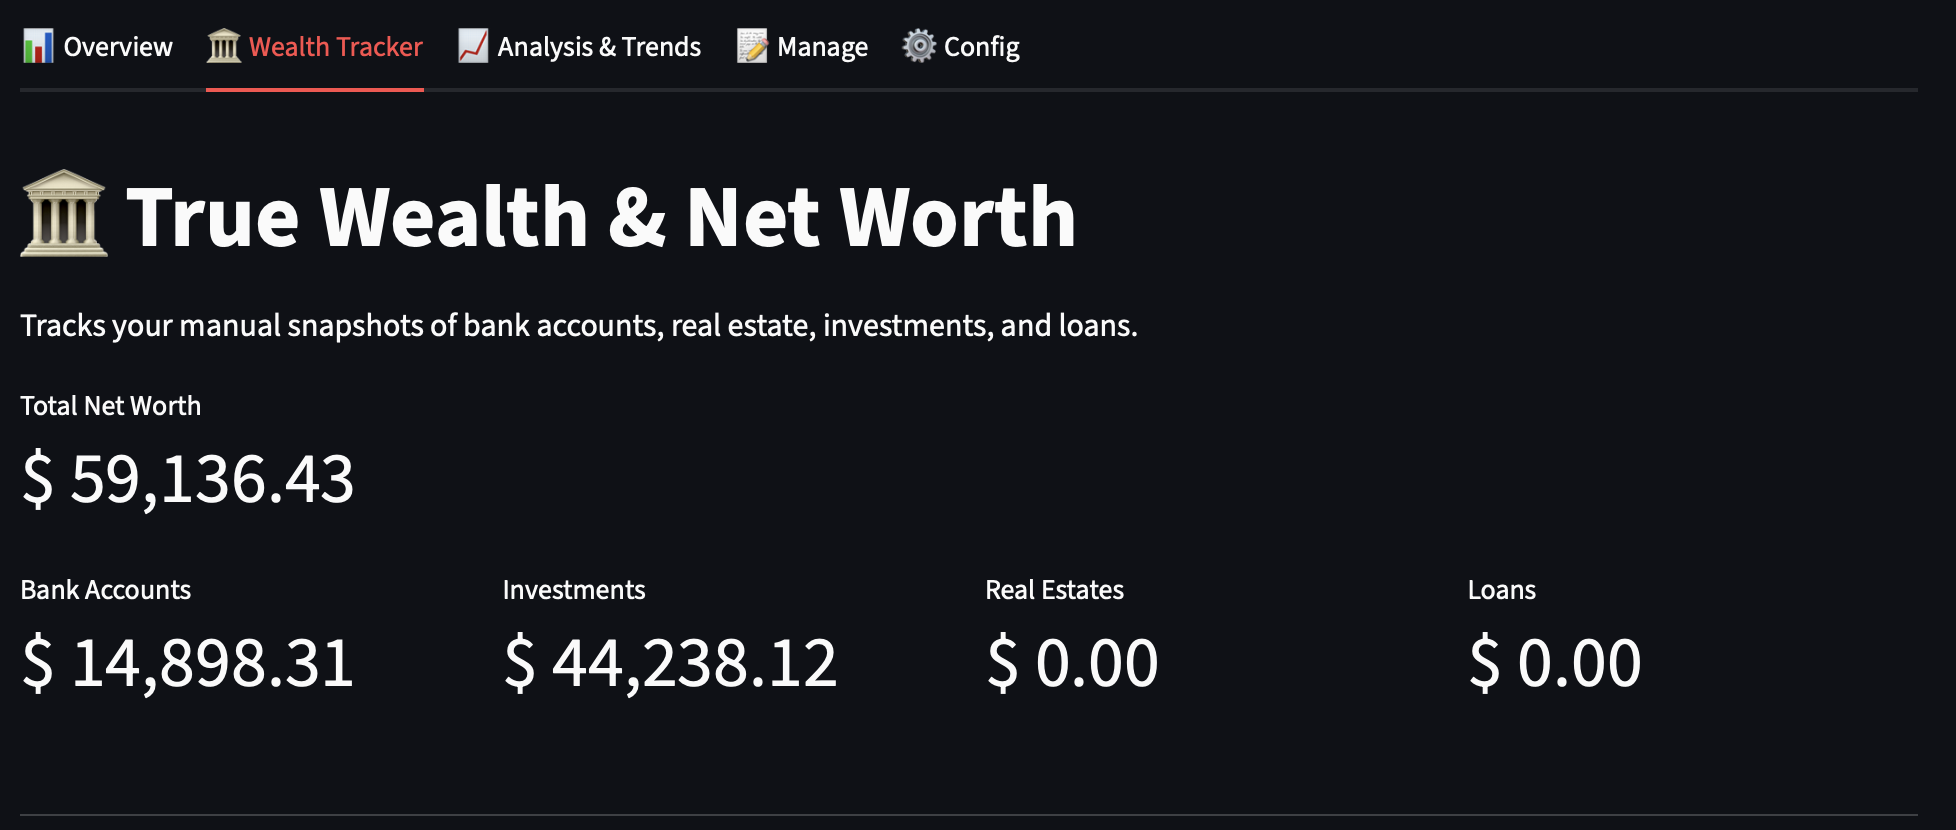
Step 4: The Horizon (Tracking FIRE and Net Equity)
Tracking your monthly budget is only half the battle. If your goal is early retirement, you need to track your Net Equity—the complex equation of your real estate assets, fluctuating investment portfolios, liquid cash, and remaining loan balances.
FinFortress features a dedicated Wealth Tracker tab to map your macro-financial horizon.
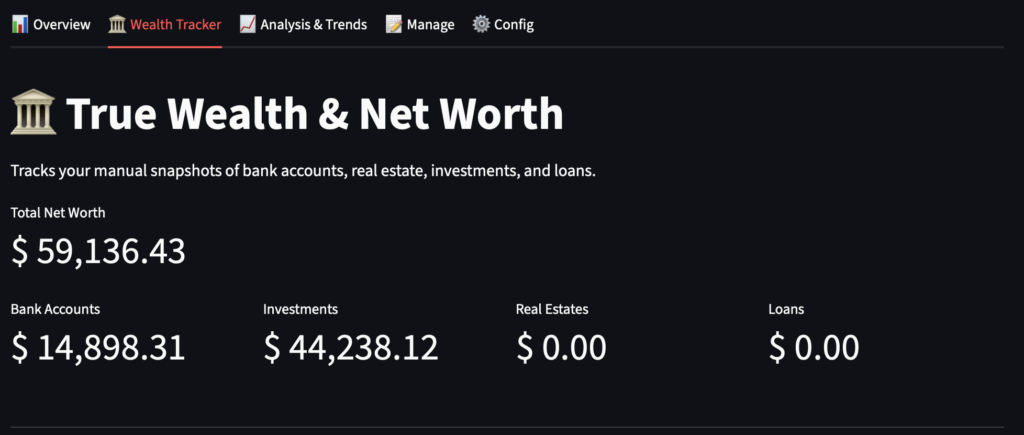
How to track your net worth: You simply log your assets once a month in the local manual_wealth_log.csv file. You define the Asset Name, the Category (e.g., Real Estates, Investments, Loans), and the current Value. If it’s an investment, you can even add your cost basis so the app can track your all-time market returns.
FinFortress takes this simple spreadsheet and transforms it into:
- The Wealth Waterfall: A beautifully rendered chart that subtracts your debts (mortgages, student loans) from your assets in real-time, showing your true net worth.
- FIRE Projections: Based on your calculated savings rate and investment balances, the dashboard calculates exactly what year your portfolio will be able to completely cover your living expenses.
Take Control of Your Financial Telemetry
We meticulously track the data of our daily lives – from our fitness metrics to our screen time – yet we carelessly outsource the data that funds our independence.
By running your personal finance engine locally, you eliminate the risk of subscription fatigue, sudden platform shutdowns, and data brokers. Your historical data, your custom categories, and your financial future belong strictly to you.
If you are a developer, a data nerd, or just someone who wants enterprise-grade analytics without the SaaS price tag, it is time to build your own launchpad.
👉 Try the FinFortress Read-Only Interactive Demo Here
👉 Download the Full FinFortress App on Gumroad Here
Leave a Reply