Have you ever heard the phrase, “Birds of a feather flock together”? Or perhaps, “You are the average of the five people you spend the most time with”?
It turns out that human sociology isn’t the only place where these rules apply. In the world of Machine Learning, there is an incredibly elegant, highly effective algorithm that operates on this exact same principle. It’s called k-Nearest Neighbors (KNN).
If you are just dipping your toes into data science, KNN is the perfect starting point. It requires no complex calculus to understand, relies on basic geometry, and aligns perfectly with human intuition. Let’s break down exactly how it works, why it’s so powerful, and how to choose its most critical parameter.
What is k-Nearest Neighbors?
At its core, k-Nearest Neighbors (KNN) is a supervised machine learning algorithm used for both classification(predicting a category) and regression (predicting a continuous value/number).
Unlike other algorithms that spend hours “training” to find a complex mathematical formula that separates data, KNN is a bit of a procrastinator. It is known as a lazy learner. It doesn’t really learn a model during training; instead, it simply memorizes the entire training dataset. When you give it a new, unseen data point and ask for a prediction, that is when KNN goes to work.
The Intuition: How KNN Works in 3 Steps
Imagine you move into a new neighborhood, and you want to know if the local culture leans more toward “Sci-Fi Fanatics” or “Reality TV Buffs.” You don’t have a map of the whole town’s preferences, so you decide to ask your 5 closest neighbors what they like. If 4 of them say Sci-Fi and 1 says Reality TV, you can reasonably guess that your immediate area leans heavily toward Sci-Fi.
That is KNN in a nutshell. Here is how the algorithm handles it mathematically:
Step 1: Calculate Distance
When a new data point arrives, the algorithm calculates how far away this new point is from every single point in its memorized database.
Step 2: Find the “k” Closest Neighbors
The “k” in KNN is simply a number that you choose. If you choose k=3, the algorithm looks for the 3 closest data points (neighbors) to the new point. If you choose k=5, it looks for the top 5.
Step 3: Vote or Average
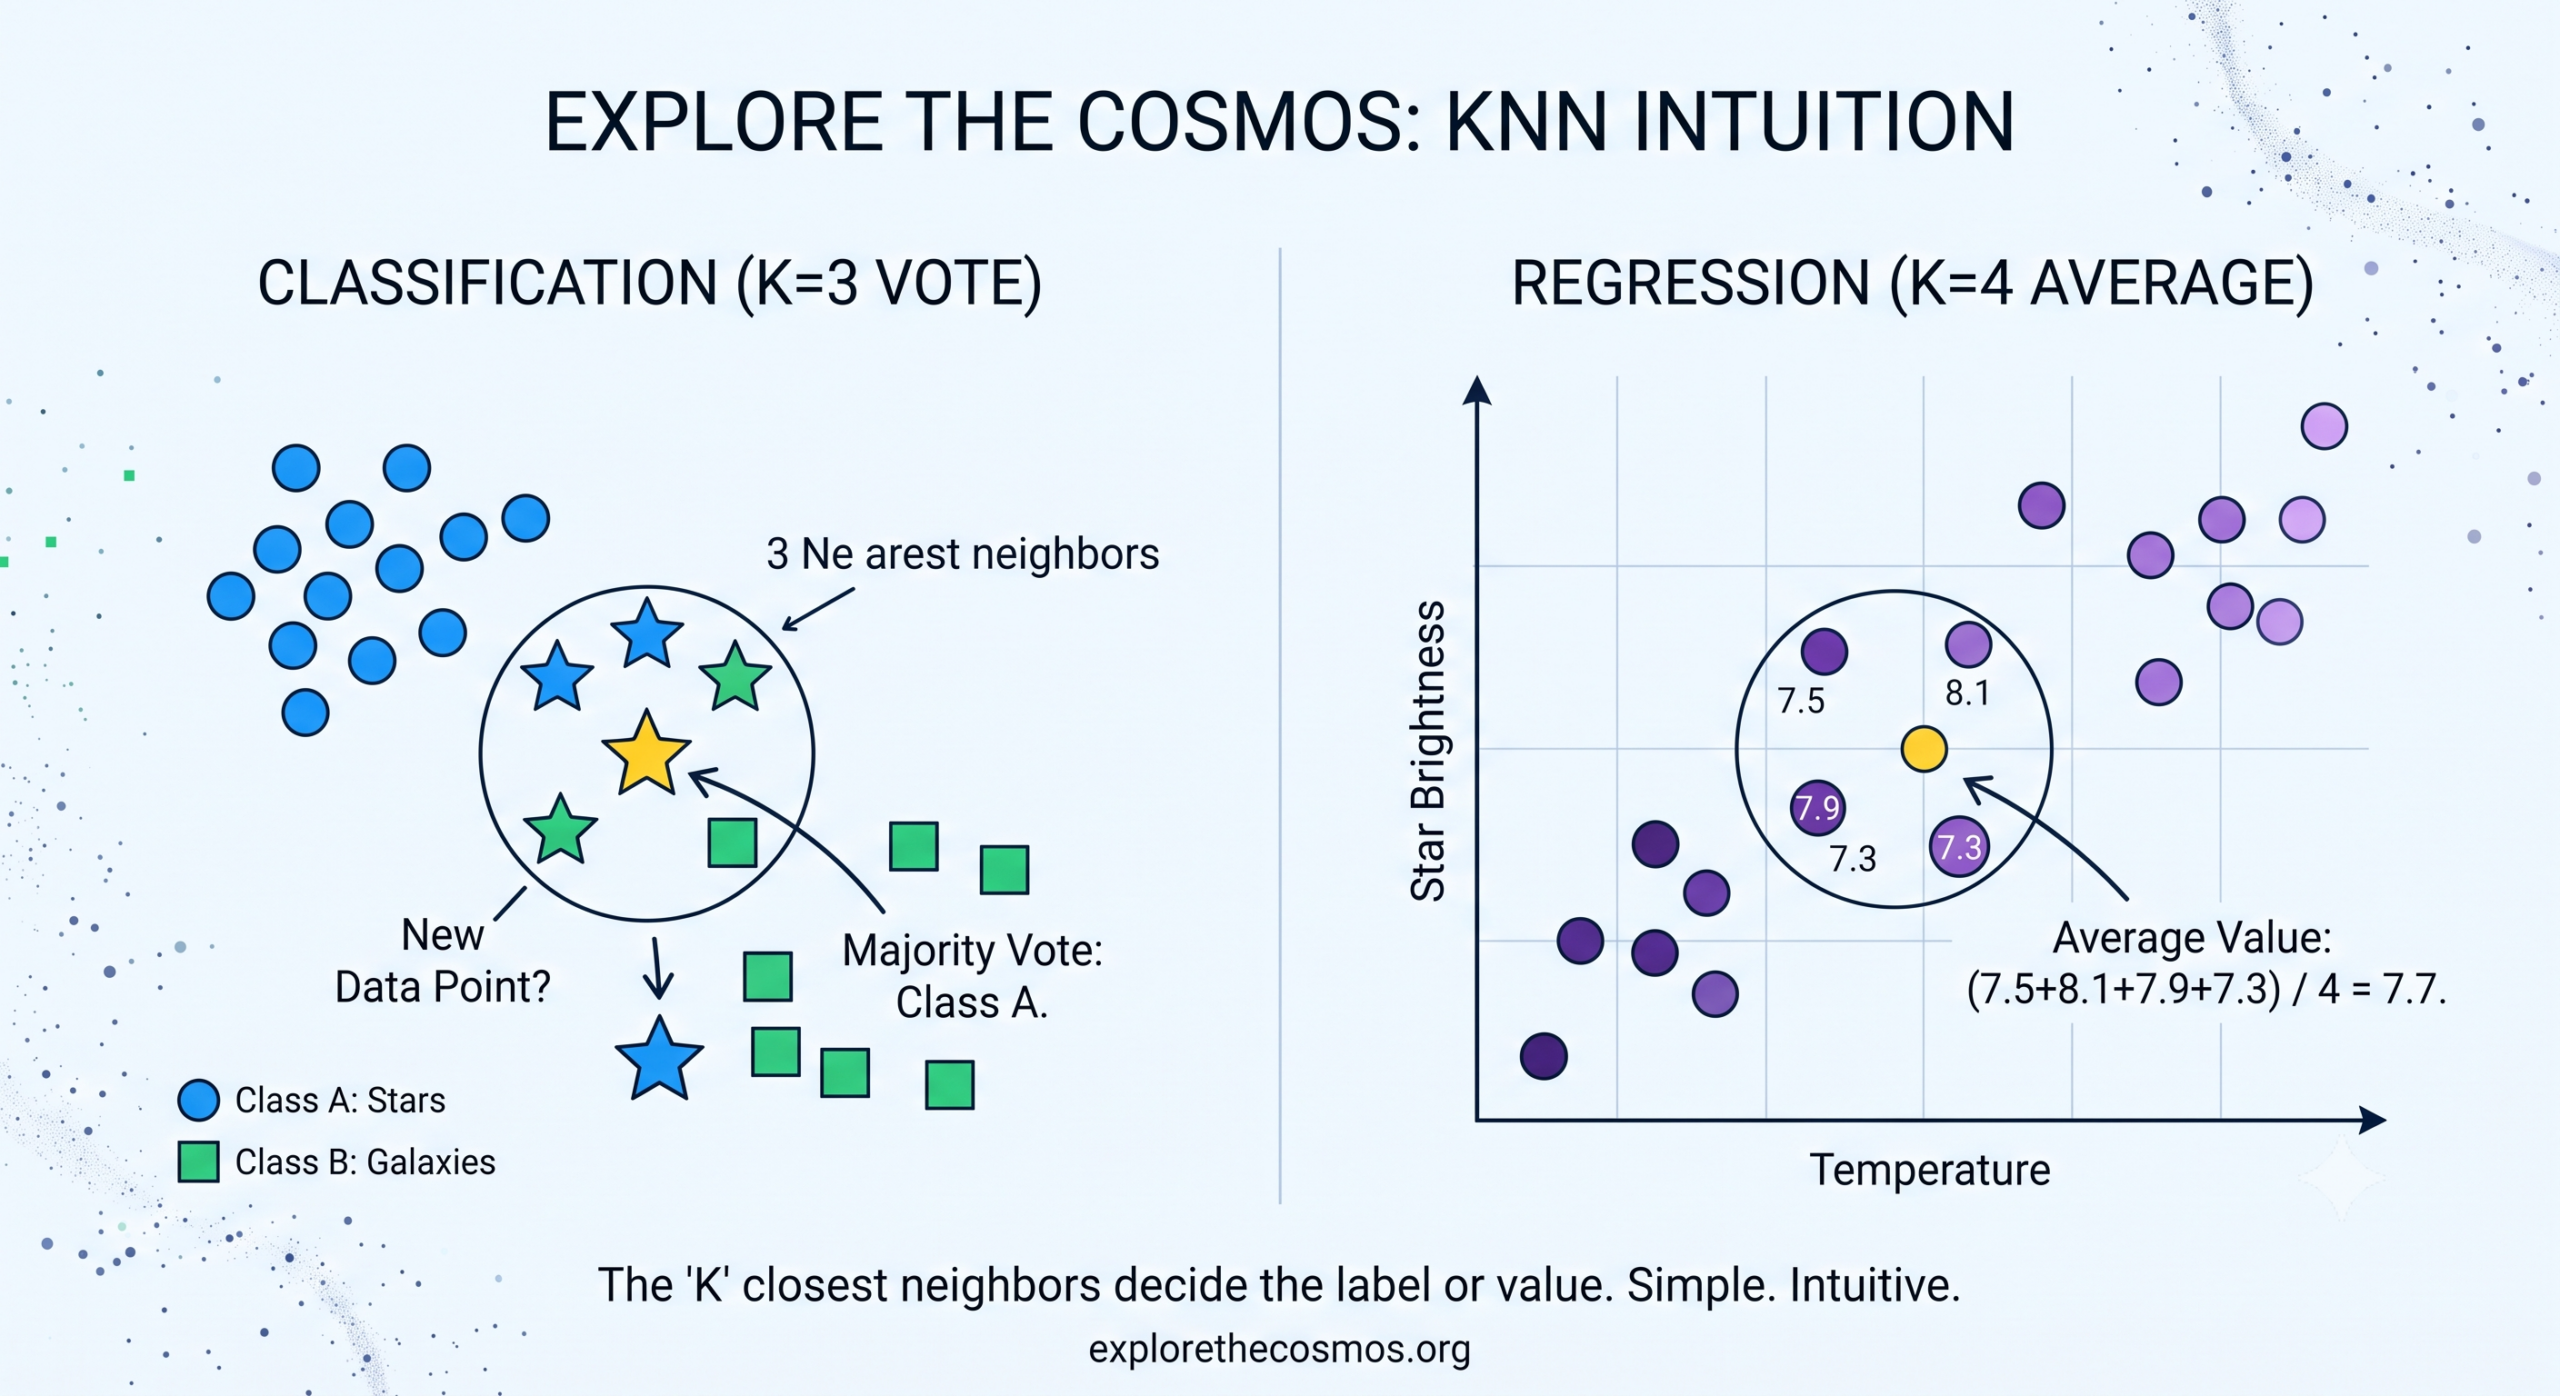
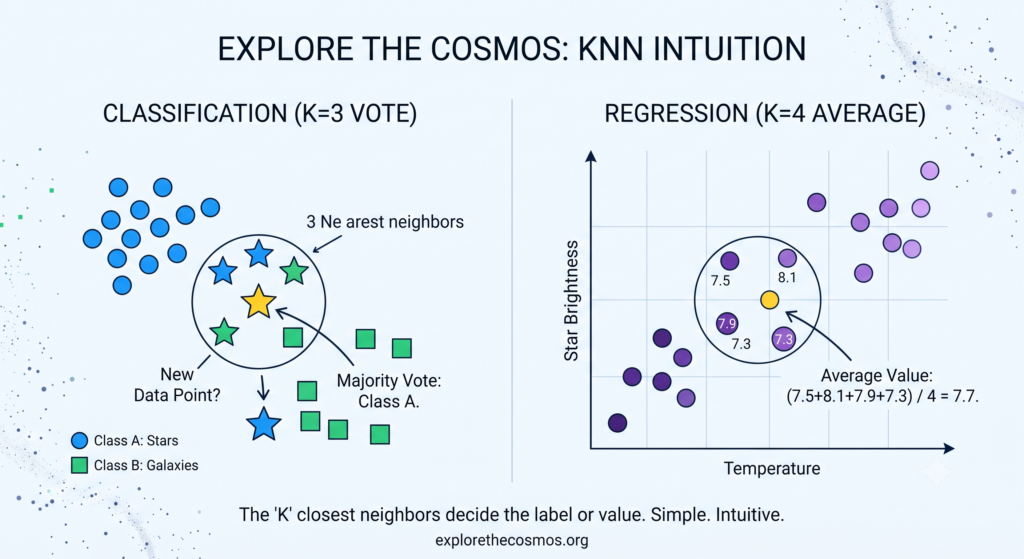
- For Classification: The algorithm looks at the labels of those “k” neighbors and takes a majority vote. Whatever category is most common among the neighbors becomes the prediction for the new point.
- For Regression: If you are trying to predict a number (like a house price), KNN simply takes the average value of those “k” neighbors.
How Does KNN Measure “Closeness”?
When we talk about “closest neighbors” in a dataset, we aren’t talking about physical distance on a street. We are talking about feature space.
If we are classifying stars, our features might be Brightness and Temperature. If we plot these two features on a graph, every star becomes a coordinate. To find the distance between a new star and the known stars, KNN typically uses the Euclidean Distance formula (which is just the Pythagorean theorem you learned in high school):
d=(x2−x1)2+(y2−y1)2
If your data has more than two features (e.g., Brightness, Temperature, Mass, and Distance from Earth), the math expands into higher dimensions, but the core concept remains exactly the same.
Choosing the Right “k”: The Goldilocks Problem
The choice of k is the most important decision you make when using this algorithm. It controls the balance between a model that is too sensitive to noise and one that is too generic.
- If k is too small (e.g., k=1): The model is highly sensitive to outliers. If your closest neighbor happens to be a mislabeled data point (noise), your prediction will be wrong. This leads to overfitting.
- If k is too large (e.g., k=100): The neighborhood becomes too large. It begins inviting data points from other distinct groups, blurring the boundaries. This leads to underfitting.
Pro Tip: As a general rule of thumb, data scientists often start by setting k=n
, where n is the total number of data points in your training set. Additionally, always choose an odd number for k when doing binary classification to prevent tie votes!
Pros and Cons of KNN
Like any tool in a data scientist’s toolkit, KNN has scenarios where it shines and others where it stumbles.
| Advantages (The Good) | Disadvantages (The Bad) |
|---|---|
| Incredibly Simple: Easy to understand, explain, and implement. | Computationally Expensive: Because it calculates distances to everypoint at prediction time, it gets incredibly slow as your dataset grows. |
| No Assumptions: It makes zero assumptions about the structure of your data (non-parametric). | High Memory Usage: It requires storing the entire dataset in memory to make predictions. |
| Versatile: Works beautifully for both classification and regression. | Curse of Dimensionality: If you have too many features, the “distance” between points becomes less meaningful, causing performance to drop. |
Wrap-Up: When Should You Use KNN?
KNN is an exceptional baseline model. If you have a clean, labeled dataset with a relatively small number of rows and features, KNN can deliver surprisingly accurate results with almost zero setup time. It is widely used in simple recommendation systems, basic image recognition, and anomaly detection.
The next time you look at a cluster of stars or a group of data points, remember: sometimes the best way to figure out who you are is simply to look at who is standing right next to you.
Want to see KNN in action with Python? Drop a comment below if you’d like a step-by-step tutorial using Scikit-Learn in our next post! Don’t forget to subscribe to Explore the Cosmos for your weekly dose of data science and astronomy.
Leave a Reply