Have you ever noticed how some things in life just seem to cluster around an average, while extreme instances are surprisingly rare? Think about the height of adults in your city, the scores on a standardized test, or even the consistent power output you achieve during a sustained cycling effort. Most values hover near the middle, with fewer and fewer occurrences as you move to the very high or very low ends.
This isn’t a coincidence; it’s the fundamental principle of the Normal Distribution, often called the “bell curve.” At Explore the Cosmos, our mission is to demystify complex systems and human performance through data-driven analysis. Understanding the normal distribution is a cornerstone of this journey, providing the lens through which we interpret everything from your cycling metrics to the vast patterns of the universe.
In this comprehensive guide, we’ll explain what a normal distribution is, why it’s so pervasive in the real world, and how its principles are being leveraged in cutting-edge data analysis trends in 2026. We’ll show you why this foundational concept is indispensable for anyone curious about science, data, and discovery, helping you move from guesswork to informed understanding.
What is the “Normal” in Normal Distribution?
At its heart, a normal distribution describes a specific type of continuous probability distribution where data tends to cluster around a central value, with the frequency decreasing symmetrically as you move further away from that center. Visually, this creates the iconic symmetrical, bell-shaped curve, which is why it’s also known as the Gaussian distribution.
Let’s break down its key characteristics:
- Symmetry: The left and right sides of the bell curve are mirror images of each other.
- Central Tendency: The mean, median, and mode are all equal and located at the exact center of the distribution, representing the peak of the curve.
- Defined by Two Parameters: A normal distribution is entirely characterized by its mean (μ), which dictates the center, and its standard deviation (σ), which measures the spread or variability of the data. If you know these two numbers, you know the entire distribution.
The Empirical Rule: Your Data’s Fingerprint
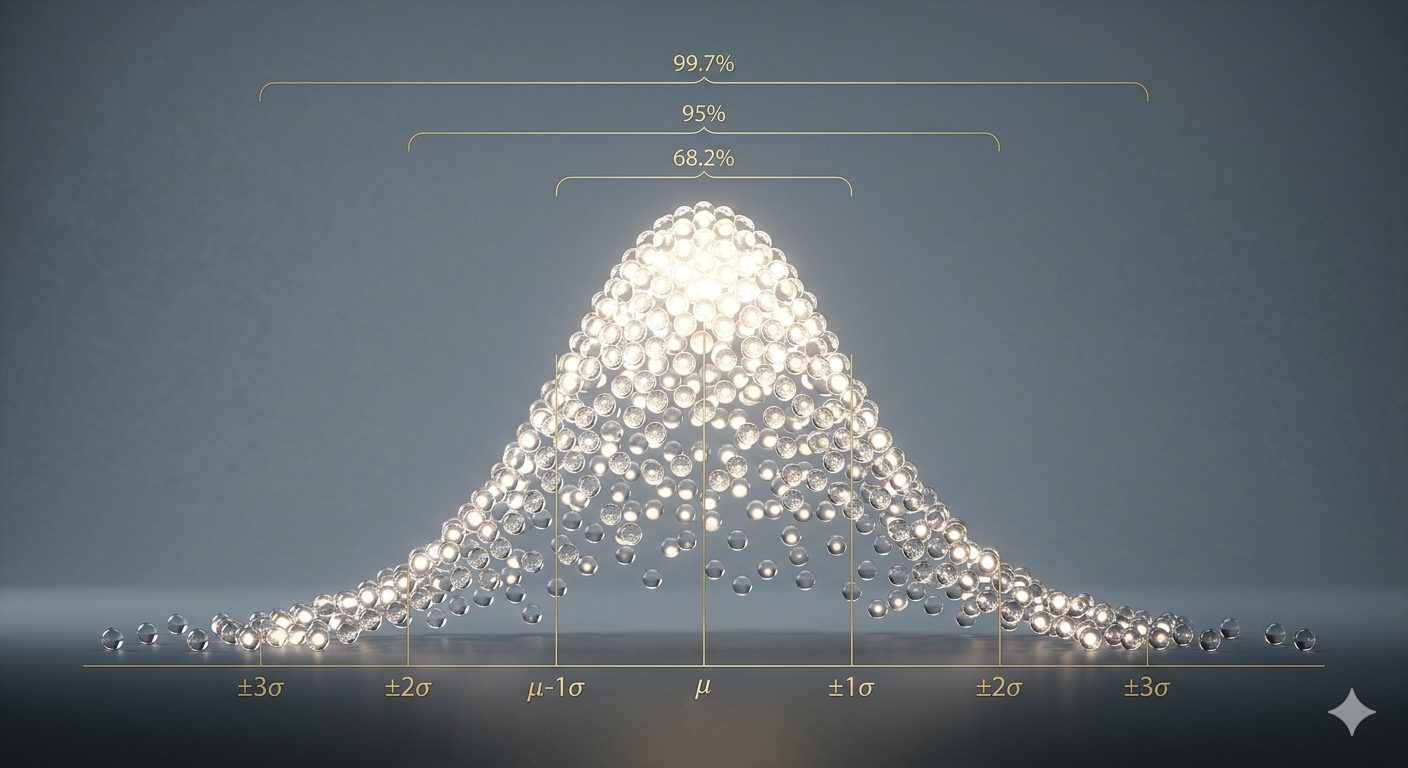
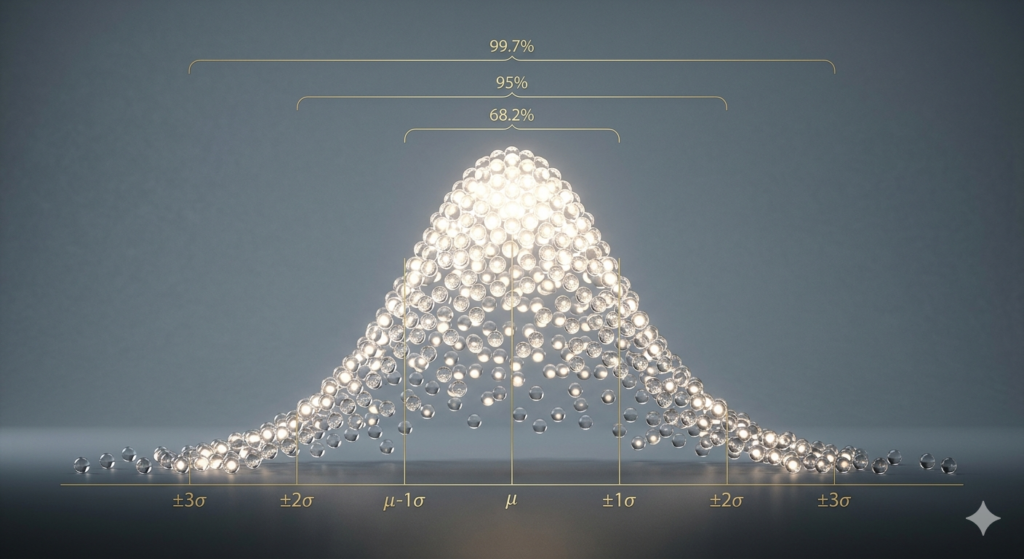
One of the most powerful aspects of the normal distribution is the Empirical Rule, also known as the 68-95-99.7 rule. This rule provides a quick way to understand the spread of your data:
- Approximately 68% of the data falls within one standard deviation (±1σ) of the mean.
- Approximately 95% of the data falls within two standard deviations (±2σ) of the mean.
- Approximately 99.7% of the data falls within three standard deviations (±3σ) of the mean.
This predictable structure is incredibly helpful because if we take a sample of data, calculate its mean and standard deviation, and assume the data-generating process is approximately normal, we can get a very good picture of the entire distribution.
Why Normal Distributions Matter: The Backbone of Data Understanding
Understanding normal distributions isn’t just academic; it’s incredibly practical. For data-curious individuals, recreational cyclists, or professionals seeking to demystify data science concepts, the normal distribution is a foundational concept for several reasons:
- Statistical Inference: Many statistical tests and models, from t-tests and confidence intervals to linear regression and ANOVA, assume that the underlying data (or the errors in the model) are normally distributed. This makes checking for normality a crucial first step in many analyses.
- Simplicity from Complexity: It allows us to summarize vast datasets with just two numbers: the mean and standard deviation. This simplicity empowers us to compare different datasets, make predictions, and set expectations.
- Anomaly Detection: By understanding the “normal” range of data based on standard deviations, we can easily identify “outliers” or anomalies – data points that fall far outside the expected pattern. This is critical for everything from detecting unusual health patterns to identifying manufacturing defects.
Normal Distributions in Real Life: From Cycling to the Cosmos
The bell curve appears in countless real-world scenarios, influencing everything from the microscopic to the cosmic:
Human Performance & Health
This is where our “human performance” pillar truly comes alive. Many biological and physiological measurements in large populations tend to follow a normal distribution:
- Cycling Metrics: While individual ride data might fluctuate wildly, certain aggregated metrics across a large group of cyclists, or even your own performance over many identical efforts, can approximate a normal distribution. For instance, your average power output for a specific 20-minute time trial, when repeated numerous times, might show a bell curve around your typical performance. Our Apple Health Cycling Analyzer, a privacy-first tool that processes your Apple Health export data, helps you understand these patterns without uploading your data to any server. By analyzing metrics like efficiency factor, HR drift, or VAM, we can help you identify your “normal” range and spot deviations that might indicate fatigue, overtraining, or a breakthrough performance.
- Physical Characteristics: Human height, weight, blood pressure, and even shoe sizes often exhibit a normal distribution within a given population. Most people are near the average height, with fewer being extremely tall or short.
- Cognitive Abilities: IQ scores are a classic example, designed to be normally distributed with a mean of 100 and a standard deviation of 15.
Quality Control & Manufacturing
In manufacturing, normal distributions are crucial for maintaining quality. The slight variations in product dimensions, component weights, or the fill volume of bottles often follow a bell curve around the target specification. This allows engineers to set acceptable tolerance limits and identify defective products efficiently.
Natural Phenomena & Space Science
Beyond human endeavors, the normal distribution also describes many natural occurrences:
- Measurement Noise & Experimental Errors: In scientific experiments, slight errors in measurement or random noise often follow a normal distribution. Understanding this allows scientists to account for variability and draw more accurate conclusions.
- Astronomical Data: While not a primary focus of our current articles, the “Explore the Cosmos” brand aligns with data-driven exploration of space. Data points such as the brightness of certain types of stars or the distribution of planet sizes within a given stellar system can exhibit normal or near-normal distributions, helping astronomers categorize and understand cosmic phenomena.
The Future is Normal: 2026 Trends in Data Analysis
As we move further into 2026, the application and interpretation of normal distributions are evolving, particularly with the rise of advanced analytics and Artificial Intelligence. Here are three key trends we’re observing:
1. AI-Driven Insights & Automated Anomaly Detection
AI is increasingly integrated into data analysis workflows, transforming how we interact with data. In 2026, AI systems are becoming more sophisticated, capable of spotting statistical errors, raising data quality concerns, and proposing analytical methods – often implicitly leveraging the principles of normal distribution. This shift means that instead of manually identifying the expected range of a metric like your average power on a long climb, AI tools can help establish that “normal” baseline and flag any performance data that deviates significantly. This automation helps you focus on *why* the anomaly occurred, rather than just identifying it.
2. Contextual AI and Data Quality Focus
The era of “one-size-fits-all” AI is giving way to specialized, context-aware models. In complex domains like healthcare and supply chain management, there’s a strong emphasis on data quality, relevance, and interoperability. This trend highlights the importance of understanding when and where normal distributions genuinely apply, rather than blindly assuming them. For instance, while height might be normally distributed, wealth distribution is decidedly not. Specialized AI is being developed to handle these nuanced datasets, identifying patterns even when they don’t conform to a perfect bell curve. This allows for more precise analysis and tailored insights, respecting the unique characteristics of different data types, which is crucial when we demystify complex ML concepts.
3. Real-Time Predictive Analytics for Proactive Strategies
Industries are increasingly leveraging predictive analytics and AI to anticipate needs and improve operational efficiency in real-time. This involves analyzing historical data and trends to make accurate forecasts. Normal distributions play a crucial role here, as they often underpin the statistical models used for understanding variability and making predictions. For example, in optimizing training, understanding the normal distribution of your heart rate recovery times can help predict your readiness for the next intense session. By establishing robust “normal” baselines, systems can spot short-term shifts sooner and enable proactive adjustments, turning raw data into actionable insights for improved performance and decision-making.
Beyond the Bell Curve: Acknowledging Limitations
While the normal distribution is incredibly prevalent and powerful, it’s vital to remember that not all data in the world follows this pattern. As we emphasize in our data science articles, it’s important to acknowledge limitations honestly.
For example, wealth distribution, the number of followers on social media, or website traffic often exhibit highly skewed distributions, meaning they have a long tail on one side rather than being symmetrical. Trying to apply normal distribution assumptions to such data would lead to inaccurate conclusions.
Therefore, a key part of our data science approach at Explore the Cosmos is to always define technical terms and acknowledge limitations. Before assuming normality, it’s crucial to visualize your data using tools like histograms and perform statistical tests for normality. If your data isn’t normally distributed, there are other powerful statistical tools, like transformations or non-parametric tests, that can still extract meaningful insights.
Embrace the Power of Data
The normal distribution is more than just a statistical curve; it’s a fundamental pattern that helps us make sense of the world, from the subtleties of human performance to the grand scale of the cosmos. By understanding its characteristics and its applications, you gain a powerful lens for data-driven discovery.
At Explore the Cosmos, we are committed to providing you with clear explanations and practical, actionable information. Whether you’re a data-curious cyclist looking to optimize your training with our Apple Health Cycling Analyzer or a professional wanting to demystify machine learning concepts, understanding distributions is key.
Ready to dive deeper into your own data and uncover hidden insights? Explore our articles on interpreting Apple Watch cycling metrics or how to increase your cycling VO₂max with a data-driven protocol. Start using data instead of guessing, and truly understand what your numbers mean.
Leave a Reply