
You’ve heard the term everywhere. Job postings demand it. LinkedIn influencers preach it. Universities charge five figures to teach it. And yet, if you asked ten people to define “data science,” you’d get twelve different answers – most of them wrong.
Data science has become one of the most hyped, most misused, and most genuinely misunderstood terms in modern technology. It gets conflated with artificial intelligence. It gets reduced to “making charts.” It gets inflated into some mystical practice that requires a PhD and a supercomputer. None of that is accurate.
The confusion isn’t harmless. People avoid learning data science because they think it requires advanced mathematics they’ll never grasp. Businesses hire “data scientists” to build dashboards – then wonder why they didn’t need a six-figure salary for that. Students enroll in data science programs expecting to build AI, then spend a semester cleaning spreadsheets and wonder if they chose wrong.
This guide cuts through the noise. What data science actually is. What it isn’t. How it relates to – but differs from – statistics, machine learning, artificial intelligence, and data analytics. And why understanding the distinction matters whether you’re considering a career, building a product, or simply trying to make sense of your own data.
Data Science, Defined Without the Jargon
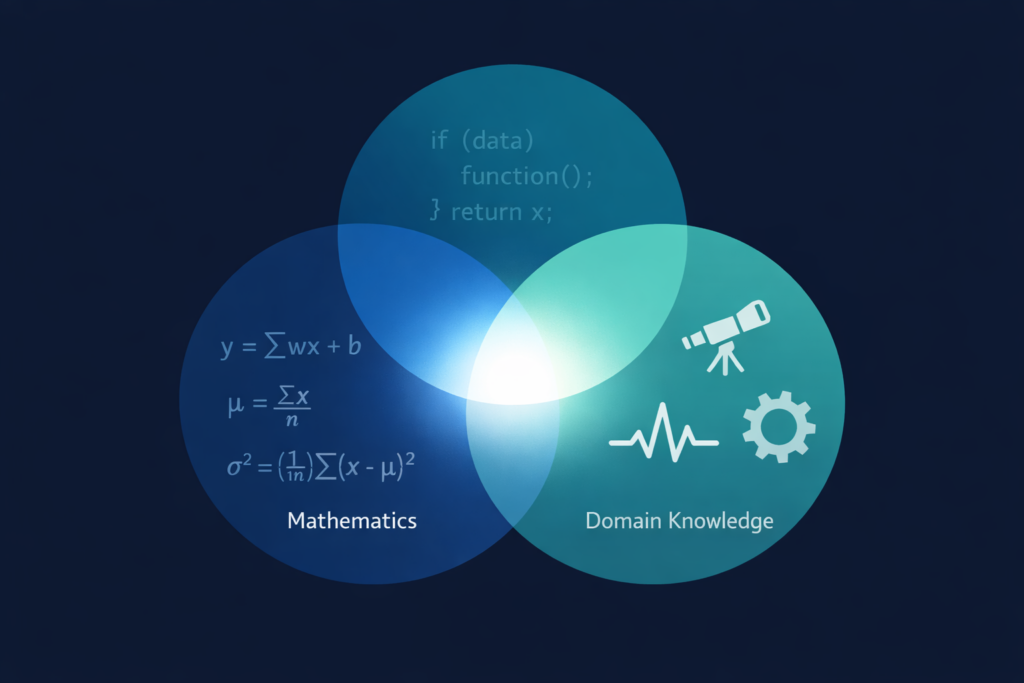
At its core, data science is the practice of extracting meaningful insight from data through a combination of statistical thinking, computational tools, and domain knowledge.
That’s it. Three ingredients:
- Statistical thinking – understanding how to ask questions of data, recognize patterns, quantify uncertainty, and avoid being fooled by randomness
- Computational tools – using programming, algorithms, and software to process data at scales and speeds that manual analysis can’t achieve
- Domain knowledge – understanding the real-world context that determines which questions matter, which patterns are meaningful, and which results are actionable
Remove any one of these three, and you don’t have data science. You have something else – potentially still valuable, but fundamentally different.
A statistician with deep mathematical knowledge but no programming skills can analyze small datasets rigorously but can’t scale. A programmer who can wrangle massive datasets but doesn’t understand statistical reasoning will find patterns that aren’t real. An analyst with domain expertise but no statistical or computational foundation will tell compelling stories that the data doesn’t actually support.
Data science lives at the intersection of all three. Not as a master of any single discipline, but as the practice that bridges them.
The Data Science Process: What Actually Happens
The popular image of a data scientist involves someone staring at streams of numbers on a dark screen, occasionally saying things like “the algorithm detected an anomaly.” The reality is less cinematic and more methodical.
Here’s what the data science process actually looks like – the version nobody puts on conference slides because it isn’t glamorous:
Step 1: Define the Question (10% of the Work, 50% of the Value)
Before touching any data, a data scientist needs to define what problem they’re solving. This sounds obvious. It’s where most projects fail.
Bad question: “What does our data say?”
Good question: “Why did customer retention drop 12% in Q3 among users who signed up through mobile?”
Bad question: “Can we use AI on this?”
Good question: “Can we predict which manufacturing components will fail within the next 30 days based on sensor readings?”
The question shapes everything that follows – what data you need, what methods are appropriate, and what constitutes a useful answer. A vague question guarantees a vague result.
Step 2: Collect and Access Data (15% of the Work)
Data rarely arrives in a clean, ready-to-analyze format. It lives in databases, APIs, spreadsheets, log files, sensor outputs, PDFs, and sometimes in formats that would make any reasonable person question humanity’s relationship with technology.
A data scientist needs to:
- Identify which data sources are relevant to the question
- Access those sources (which often involves navigating permissions, technical integrations, and organizational politics)
- Assess data quality before building anything on top of it
Step 3: Clean and Prepare Data (40-60% of the Work)
This is the step that surprises everyone who hasn’t done data science.
Data cleaning consumes the majority of most data science projects. Not modeling. Not visualization. Not algorithm selection. Cleaning.
Real-world data is messy in ways that are hard to appreciate until you’ve experienced them:
| Data Quality Issue | Example | How Common |
| Missing values | 23% of records have no entry for a critical field | Extremely common |
| Inconsistent formatting | Dates stored as “03/15/2024,” “March 15, 2024,” “2024-15-03,” and “15.3.24” in the same column | Universal |
| Duplicate records | The same event logged twice due to a system glitch | Common |
| Outliers (real) | A sensor reading of 450°C in a process that normally runs at 80°C – because something actually went wrong | Occasional |
| Outliers (errors) | A sensor reading of 450°C because the sensor malfunctioned | Also occasional – and indistinguishable from the above without context |
| Schema changes | The database structure changed six months ago, and nobody told you | Painfully common |
| Selection bias | Your dataset only contains customers who didn’t cancel – so you can’t study why people cancel | Subtle and dangerous |
This isn’t grunt work to rush through. The quality of your analysis is bounded by the quality of your data preparation. A sophisticated machine learning model trained on poorly cleaned data will produce confidently wrong answers – which is worse than no answer at all.
Step 4: Explore and Analyze (15-20% of the Work)
With clean data, the actual analysis begins. This typically involves:
- Exploratory data analysis (EDA): Visualizing distributions, relationships, and patterns to develop intuition about what the data contains
- Statistical analysis: Testing hypotheses, quantifying relationships, assessing significance
- Feature engineering: Creating new variables from existing data that better capture the patterns relevant to your question
- Modeling: Applying statistical or machine learning models where appropriate – and only where appropriate
Note that modeling is one component of this step, not the entirety of it. Many valuable data science projects never involve a machine learning model at all. Sometimes a well-constructed visualization or a rigorous statistical comparison answers the question directly.
Step 5: Communicate Results (10% of the Work, Critical Importance)
An insight that nobody understands is an insight that doesn’t exist.
Data scientists translate technical findings into clear, actionable conclusions for people who make decisions – executives, engineers, product managers, doctors, or anyone else who needs to act on the information.
This means:
- Explaining what the data shows and what it doesn’t
- Quantifying uncertainty honestly rather than presenting false confidence
- Connecting findings back to the original question
- Recommending concrete actions
The best data scientists aren’t the best programmers or the best statisticians. They’re the best translators – converting data into decisions.
What Data Science Is NOT
Now for the misconceptions. These aren’t academic distinctions. They lead to real confusion, misallocated resources, and frustrated people.
Data Science Is Not Artificial Intelligence
This is the most pervasive conflation, and it causes the most damage.
Artificial Intelligence is a broad field aimed at creating systems that can perform tasks typically requiring human intelligence – reasoning, perception, language understanding, decision-making.
Data science uses some tools that overlap with AI (particularly machine learning), but the goals are fundamentally different:
| Data Science | Artificial Intelligence | |
| Primary goal | Extract insight from data | Build systems that exhibit intelligent behavior |
| Output | Analysis, predictions, recommendations | Autonomous agents, language models, perception systems |
| Scope | Broad – any domain where data exists | Specific – mimicking or extending cognitive capabilities |
| Typical deliverable | A report, a model, a dashboard, a finding | A product, a system, a capability |
A data scientist analyzing hospital readmission data to identify risk factors isn’t doing AI. They’re doing data science. An engineer building a system that reads medical images and flags anomalies is doing AI – and probably using data science techniques as part of the process.
Machine learning is a tool that both fields use. Using machine learning doesn’t make something AI, and doing data science doesn’t require machine learning.
Data Science Is Not Data Analytics
This distinction is subtler and more often debated, but it matters – especially for careers and hiring.
Data analytics focuses on describing what happened and monitoring ongoing metrics. It answers questions like:
- How many users signed up last month?
- Which marketing campaign generated the most conversions?
- What’s our revenue trend over the past four quarters?
Data science goes further – into why something happened, what will happen next, or what should we do about it:
- Why did sign-ups decline among a specific demographic?
- Which users are most likely to churn in the next 90 days?
- What intervention would most effectively improve retention?
| Data Analytics | Data Science | |
| Core question | What happened? | Why did it happen? What will happen? |
| Methods | SQL, BI tools, descriptive statistics | Statistical modeling, machine learning, experimentation |
| Output | Reports, dashboards, KPI tracking | Predictive models, causal analysis, optimization |
| Skill emphasis | Data querying, visualization, business understanding | Programming, statistics, modeling, domain expertise |
Neither is superior. Both are essential. But they’re different roles with different skills, and confusing them leads to hiring a data scientist to build dashboards (frustrating for everyone) or expecting a data analyst to build predictive models (also frustrating for everyone).
Data Science Is Not Just Statistics
Data science inherited heavily from statistics. The foundational thinking – hypothesis testing, probability, regression, distributions, sampling – comes directly from the statistical tradition.
But data science diverges from classical statistics in important ways:
- Scale: Statistics was developed for small, carefully collected datasets. Data science often works with massive, messy, observational data that violates many classical assumptions.
- Prediction vs. inference: Classical statistics emphasizes understanding why (inference). Data science often prioritizes accuracy of prediction, sometimes using models that are effective but not easily interpretable.
- Computation: Data science is inseparable from programming. Classical statistics can be – and historically was – done with pencil and paper.
- Scope: Data science encompasses data engineering, visualization, communication, and deployment in ways that pure statistics traditionally doesn’t.
A statistician might object that data science is “just statistics with better marketing.” There’s a grain of truth there – but only a grain. The computational scale, the engineering component, and the emphasis on building data products (not just publishing analyses) genuinely distinguish the field.
Data Science Is Not “Big Data”
The early 2010s conflated data science with big data so thoroughly that many people still treat them as synonyms.
Big data refers to datasets too large or complex to process with traditional tools – terabytes or petabytes of information requiring distributed computing systems.
Data science can work with big data. It can also work with 200 rows in a spreadsheet.
Some of the most impactful data science work involves small, carefully curated datasets analyzed with rigorous statistical methods. The clinical trial that determines whether a drug works might involve a few thousand patients – not “big data” by any definition – but the analytical rigor required is absolutely data science.
The size of the data doesn’t determine whether something is data science. The methodology does.
Data Science Is Not Making Charts
Data visualization is a critical part of data science. It’s also a critical part of journalism, business reporting, marketing, and countless other fields.
Creating a bar chart of monthly sales is not data science. Creating a visualization that reveals a previously unknown relationship between customer behavior patterns and churn risk – after rigorous data preparation, feature engineering, and statistical analysis – might be data science, with the chart as the communication layer.
Visualization is a communication tool within data science. It’s not the thing itself.
The Skills Landscape: What Data Scientists Actually Need
If you’re considering learning data science – or trying to understand what a data scientist on your team should be capable of – here’s an honest breakdown:
Core Technical Skills
| Skill | Why It Matters | Depth Needed |
| Python or R | Primary languages for data manipulation, analysis, and modeling | Proficient – not just syntax, but idiomatic usage with data libraries |
| SQL | Accessing and querying data from databases – where most real-world data lives | Strong working knowledge |
| Statistics & probability | Foundation for every analytical method | Solid conceptual understanding; formulaic memorization is less important than intuition |
| Machine learning fundamentals | Understanding when and how to apply predictive models | Conceptual understanding of major algorithms; knowing when NOT to use ML is as important as knowing when to use it |
| Data visualization | Communicating findings clearly | Competent – able to choose appropriate chart types and avoid misleading representations |
Underrated Non-Technical Skills
| Skill | Why It Matters |
| Problem framing | The ability to translate vague business problems into precise, answerable questions |
| Communication | Explaining technical findings to non-technical stakeholders without dumbing down or overcomplicating |
| Domain curiosity | Willingness to deeply understand the field you’re analyzing – healthcare, finance, cycling performance, astrophysics – rather than treating every domain as interchangeable |
| Skepticism | The discipline to question your own results, check for confounding variables, and resist confirming what you expected to find |
| Knowing when to stop | Recognizing when additional analysis won’t change the conclusion – and that shipping an 85% solution today beats a 95% solution next quarter |
Data Science in Practice: Examples You’ve Already Seen
If you’ve read other articles on this site, you’ve already encountered data science in action – even if it wasn’t labeled that way.
Cycling performance analysis is applied data science. Taking raw Apple Watch metrics – heart rate, speed, elevation, GPS coordinates – cleaning and structuring them, calculating derived metrics like Efficiency Factor and HR drift, establishing personal rolling baselines, and generating contextual performance assessments. That process follows every step of the data science workflow: question definition, data collection, cleaning, analysis, and communication.
Astronomical data processing is data science. When researchers analyze light curves from distant stars to detect exoplanets, they’re applying signal processing, statistical modeling, and domain expertise to extract meaningful patterns from noisy data.
Space mission planning involves data science at every stage – from trajectory optimization to resource allocation to risk modeling.
Data science isn’t confined to tech companies and Silicon Valley. It’s happening anywhere someone is systematically extracting insight from data. The methodology is universal; only the domain changes.
Why the Distinction Matters
You might be thinking: “Who cares what it’s called? If the work gets done, the label doesn’t matter.”
Fair point – up to a boundary. The distinction matters in three practical contexts:
For Career Decisions
If you want to build AI systems, study computer science and machine learning engineering. If you want to create dashboards and track business KPIs, learn data analytics. If you want to answer complex questions by combining statistical rigor, programming, and deep domain understanding – that’s data science. Entering the wrong field because the terms were blurry costs years.
For Hiring and Business Decisions
Companies that hire a “data scientist” when they need a data analyst get someone overqualified for the work and frustrated by it. Companies that hire a “data analyst” when they need a data scientist get someone unable to build the predictive models or causal analyses the business actually requires. Precise definitions enable precise hiring.
For Setting Expectations
When someone says “we’ll use data science to solve this,” understanding what that actually entails – including the 40-60% of the project spent on data cleaning – prevents unrealistic timelines, budgets, and expectations. Data science isn’t magic. It’s methodology. Methodology takes time and rigor.
The Bottom Line
Data science is the disciplined practice of extracting meaningful insight from data using statistical thinking, computational tools, and domain expertise. It’s not AI, it’s not dashboards, it’s not big data, and it’s not making charts – though it can involve all of these as components.
It’s both less glamorous and more powerful than popular culture suggests. Less glamorous because most of the work is cleaning messy data, questioning assumptions, and carefully validating results. More powerful because, when done rigorously, it reveals patterns and enables decisions that intuition alone never could.
The next time someone tells you they “do data science,” you now have the framework to understand what that actually means – and to ask the right follow-up questions.
And the next time someone conflates data science with AI, you can politely set the record straight. The fields are cousins, not twins. And knowing the difference matters more than most people realize.
Leave a Reply