Every cycling training plan uses zones. Zone 2 for base building. Zone 4 for threshold work. Zone 5 for VO2max intervals.
But here’s the uncomfortable question: how do you know your zones are correct?
If you set your heart rate zones using the “220 minus age” formula, there’s a good chance they’re wrong – potentially by 10-20 beats per minute. If you estimated your FTP without a proper test, your power zones could be off by 15% or more.
Wrong zones mean wrong training. You think you’re building aerobic base, but you’re actually training tempo. You think you’re doing threshold work, but you’re barely touching it. Months of structured training, undermined by inaccurate numbers.
This guide explains how training zones actually work, why generic formulas fail, and how to use your own ride data to establish and validate zones that reflect your physiology – not statistical averages.

What Training Zones Actually Represent
Training zones are intensity ranges that target different physiological systems. Each zone creates specific adaptations:
| Zone | Primary Energy System | Training Adaptation |
| Zone 1 | Aerobic (fat oxidation) | Active recovery, blood flow |
| Zone 2 | Aerobic (fat + glycogen) | Mitochondrial density, capillary development |
| Zone 3 | Aerobic-anaerobic mix | Muscular endurance, efficiency |
| Zone 4 | Threshold (lactate balance) | Lactate clearance, sustainable power |
| Zone 5 | VO2max (maximal aerobic) | Oxygen uptake capacity, cardiac output |
| Zone 6 | Anaerobic capacity | Glycolytic power, short-duration capacity |
| Zone 7 | Neuromuscular power | Peak force production, sprint power |
The key insight: These adaptations occur only when you actually train in that zone. If your zones are miscalibrated, you’re triggering different adaptations than intended.
Heart Rate Zones: The Accessible Option
Heart rate zones are the most accessible intensity metric – every Apple Watch tracks them continuously.
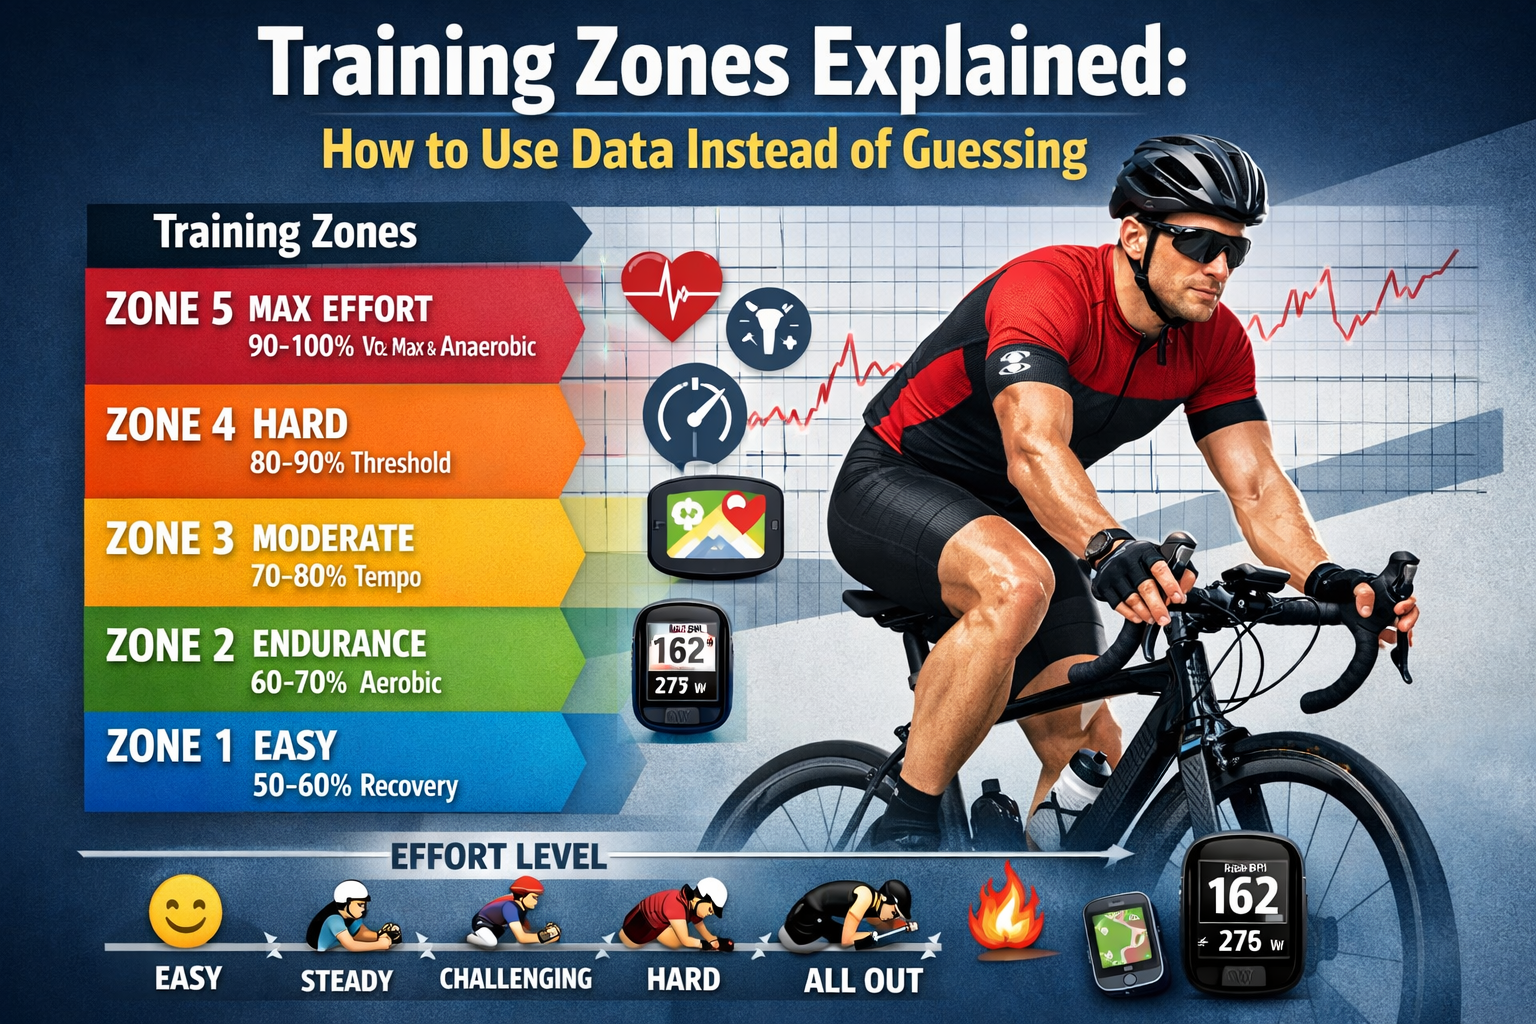
The Standard 5-Zone Heart Rate Model
| Zone | % of Max HR | % of LTHR | Perceived Effort | Purpose |
| Zone 1 | 50-60% | <81% | Very easy, conversational | Recovery |
| Zone 2 | 60-70% | 81-89% | Easy, can speak sentences | Aerobic base |
| Zone 3 | 70-80% | 90-93% | Moderate, speak in phrases | Tempo/endurance |
| Zone 4 | 80-90% | 94-99% | Hard, few words at a time | Threshold |
| Zone 5 | 90-100% | 100-106% | Very hard, can’t speak | VO2max |
Two ways to set zones:
- Percentage of Max HR: Uses your maximum heart rate as the anchor
- Percentage of LTHR: Uses your Lactate Threshold Heart Rate (more accurate)
Why “220 Minus Age” Fails
The formula “Max HR = 220 – age” is a population average with massive individual variation.
Research shows:
- Standard deviation is ±10-12 bpm
- Individual max HR can deviate by 20+ bpm from prediction
- The formula was never intended for precise training prescription
Real example:
Two 40-year-old cyclists both calculate max HR as 180 bpm (220-40).
- Cyclist A’s actual max HR: 168 bpm
- Cyclist B’s actual max HR: 192 bpm
If both use 180 bpm to set zones:
| Zone | Calculated | Cyclist A Reality | Cyclist B Reality |
| Zone 2 (60-70%) | 108-126 bpm | Actually Zone 3 | Actually Zone 1-2 |
| Zone 4 (80-90%) | 144-162 bpm | Above max HR! | Moderate Zone 3 |
Cyclist A would be overtraining constantly. Cyclist B would never reach true threshold. Both would see suboptimal results despite “following the plan.”
Better Approach: Find Your Actual Max HR
Option 1: Observe from hard efforts
Review your Apple Health data for your highest recorded heart rate during maximal efforts (sprints, steep climbs, race finishes). Your true max HR is likely within 5 bpm of your highest recorded value.
Option 2: Field test protocol
After thorough warmup:
- Find a steep hill (6-10% gradient, 3-5 minutes long)
- Start at moderate intensity
- Increase effort every 30 seconds
- Final 60 seconds: absolute maximum effort
- Record peak HR at the end
Repeat 2-3 times on different days. Your max HR is the highest value achieved.
Even Better: Find Your Lactate Threshold Heart Rate (LTHR)
LTHR is more useful than max HR because it directly represents your sustainable intensity ceiling.
30-Minute Field Test Protocol:
- Warm up 15-20 minutes with progressive effort
- Start recording a new lap/segment
- Ride 30 minutes at the hardest pace you can sustain evenly
- Record average HR for the 30 minutes
- This approximates your LTHR
Set zones from LTHR:
| Zone | % of LTHR | Example (LTHR = 165) |
| Zone 1 | <81% | <134 bpm |
| Zone 2 | 81-89% | 134-147 bpm |
| Zone 3 | 90-93% | 148-153 bpm |
| Zone 4 | 94-99% | 155-163 bpm |
| Zone 5a | 100-102% | 165-168 bpm |
| Zone 5b | 103-106% | 170-175 bpm |
Power Zones: The Objective Standard
If you have a power meter (or use Apple Watch’s cycling power estimation), power zones offer more objective intensity measurement than heart rate.
Why Power Zones Are Superior
| Factor | Heart Rate | Power |
| Response time | Delayed 30-60 seconds | Instantaneous |
| Affected by fatigue | Yes | No |
| Affected by heat | Yes | No |
| Affected by caffeine | Yes | No |
| Affected by stress | Yes | No |
| Consistent day-to-day | Variable | Consistent |
Power tells you exactly how much work you’re doing. Heart rate tells you how your body is responding to that work. Both are valuable, but power is the direct measurement.
The Coggan Power Zone Model
Based on Functional Threshold Power (FTP) – the power you can sustain for approximately one hour:
| Zone | Name | % of FTP | Duration Sustainable |
| Zone 1 | Active Recovery | <55% | Indefinite |
| Zone 2 | Endurance | 56-75% | 3-6+ hours |
| Zone 3 | Tempo | 76-90% | 1-3 hours |
| Zone 4 | Threshold | 91-105% | 20-60 minutes |
| Zone 5 | VO2max | 106-120% | 3-8 minutes |
| Zone 6 | Anaerobic | 121-150% | 30 seconds – 3 minutes |
| Zone 7 | Neuromuscular | Maximum | <30 seconds |
Finding Your FTP
20-Minute Field Test Protocol:
- Warm up 20 minutes (include some hard efforts)
- Ride 20 minutes at maximum sustainable pace
- Record average power for the 20 minutes
- Multiply by 0.95 to estimate FTP
Example: 20-minute average power = 250 watts → FTP ≈ 237 watts
Ramp Test Alternative:
- Start at low power (100-150 watts)
- Increase by 20 watts every minute
- Continue until failure
- FTP ≈ 75% of the highest 1-minute average achieved
Coming in a future version: Power zone distribution analysis and FTP estimation based on your ride data patterns.
The Validation Problem: Are Your Zones Correct?
You’ve done a field test. You’ve calculated your zones. But how do you know they’re actually right?
Signs your zones might be wrong:
| Symptom | Possible Cause |
| Zone 2 feels too easy, you get bored | Zones set too low |
| Zone 2 feels hard, you can’t talk | Zones set too high |
| Zone 4 intervals feel easy | Threshold underestimated |
| Can’t complete Zone 4 intervals | Threshold overestimated |
| No improvement after structured training | Wrong zones = wrong stimulus |
| Constant fatigue despite “easy” rides | Zones too low; always training harder than planned |
Validation Method 1: The Talk Test
Simple but effective for aerobic zones.
| Zone | Talk Test Result |
| Zone 1 | Easy conversation, could sing |
| Zone 2 | Comfortable sentences, slight awareness of breathing |
| Zone 3 | Shorter phrases, noticeable breathing |
| Zone 4 | Few words, breathing hard |
| Zone 5 | Can’t speak, gasping |
If your calculated Zone 2 feels like you can’t speak comfortably, your zones are set too low.
Validation Method 2: HR Drift Analysis
In a properly calibrated Zone 2, your heart rate should remain relatively stable during steady efforts. Significant drift suggests you’re actually in Zone 3 or higher.
The test:
- Ride 60-90 minutes at what you believe is Zone 2
- Maintain consistent effort/power throughout
- Compare average HR in first 30 minutes vs. last 30 minutes
Interpreting drift:
| HR Drift | Interpretation |
| <5% | Likely true Zone 2 |
| 5-10% | Borderline; possibly upper Zone 2 or low Zone 3 |
| >10% | Probably Zone 3 or higher; zones may be miscalibrated |
The Apple Health Cycling Analyzer calculates HR drift automatically, showing you whether your “easy” rides are actually easy.
Validation Method 3: Efficiency Factor Consistency
Your Efficiency Factor (speed or power divided by HR) should remain stable within a given zone.
What to look for:
- Within Zone 2: EF should be consistent ride-to-ride
- Zone 3: EF slightly lower than Zone 2 (HR rising faster than output)
- Zone 4: EF lower still; HR near maximum sustainable
If your EF varies wildly on rides you thought were the same intensity, your zone calibration may be off – or you’re not holding steady intensity.
Validation Method 4: Workout Completion Quality
Can you actually complete the prescribed workout?
Threshold intervals (Zone 4):
- Should be hard but completable
- If you can’t finish the final interval, threshold is overestimated
- If intervals feel comfortable, threshold is underestimated
VO2max intervals (Zone 5):
- Should feel maximal
- HR should reach 90-95%+ of max by end of intervals
- If HR stays below 90%, zones may be too low
Using Ride Data to Refine Your Zones
The best zone validation comes from analyzing patterns across multiple rides.
Step 1: Categorize Your Recent Rides
Review your last 10-20 rides and categorize by intended intensity:
| Ride Type | Expected Zone | Expected HR Range | Expected EF |
| Easy/recovery | Zone 1-2 | <75% max | Highest |
| Endurance | Zone 2 | 65-75% max | High |
| Tempo | Zone 3 | 75-85% max | Moderate |
| Intervals | Zone 4-5 | 85-100% max | Lower |
Step 2: Compare Expected vs. Actual
Upload your rides to the Apple Health Cycling Analyzer and examine:
For “easy” rides:
- Is average HR actually in your Zone 2 range?
- Is HR drift low (<5%)?
- Is efficiency factor high and consistent?
For “hard” rides:
- Did HR reach the expected zone?
- How quickly did HR recover between intervals?
- Did efficiency drop as expected under high intensity?
Step 3: Identify Patterns
Look for consistent mismatches:
| Pattern | Likely Issue | Solution |
| “Easy” rides always show high HR drift | Zone 2 ceiling too high | Lower Zone 2 upper limit by 5-10 bpm |
| Can never reach calculated Zone 5 | Max HR underestimated | Retest max HR with hard effort |
| Threshold intervals always feel too easy | FTP/LTHR underestimated | Retest threshold |
| Constant fatigue despite following zones | All zones too low; chronically overtraining | Raise all zone boundaries |
Step 4: Adjust and Revalidate
Make zone adjustments based on data patterns, then monitor the next 2-4 weeks of training:
- Does Zone 2 now feel appropriately easy?
- Can you complete Zone 4 intervals as prescribed?
- Is HR drift within expected ranges?
Zone Distribution: The Training Balance Check
Beyond calibration, analyzing how you distribute time across zones reveals training balance.
The Polarized Distribution (Recommended)
Research supports a “polarized” approach for endurance athletes:
| Zone | % of Training Time |
| Zone 1-2 (easy) | 75-80% |
| Zone 3 (moderate) | <5% |
| Zone 4-5 (hard) | 15-20% |
Why this works: Easy training builds aerobic base without accumulating fatigue. Hard training provides the stimulus for adaptation. Moderate training (Zone 3) creates fatigue without strong adaptation – the “black hole” of training.
The Threshold Distribution (Alternative)
Some athletes respond better to more Zone 3-4 work:
| Zone | % of Training Time |
| Zone 1-2 | 60-70% |
| Zone 3-4 | 25-35% |
| Zone 5+ | 5-10% |
Common Distribution Mistakes
Mistake 1: All Zone 3, all the time
Many cyclists default to “moderate” effort on every ride. It feels productive – you’re working! – but it’s the least effective intensity for adaptation.
Data signature: Most rides show similar average HR (75-85% max), EF consistently moderate, minimal time at very easy or very hard intensity.
Mistake 2: Too much intensity
Enthusiasm leads to going too hard too often. Every ride becomes a test.
Data signature: Average HR consistently high (>80% max), chronic HR elevation, declining efficiency over weeks, elevated resting HR.
Mistake 3: No true easy rides
“Easy” rides still contain surges, chasing other cyclists, pushing on climbs.
Data signature: High HR variability on recovery rides, max HR surprisingly high even on “easy” days, HR drift elevated.
Coming in a future version: Automatic zone distribution analysis showing your time-in-zone patterns across all rides with recommendations for training balance.
Practical Zone Implementation
Setting Up Your Zones
Heart rate zones (if no power meter):
- Find your actual max HR from hard efforts
- Perform 30-minute test for LTHR
- Set zones based on LTHR percentages
- Validate with talk test and HR drift analysis
Power zones (if power meter available):
- Perform 20-minute FTP test
- Calculate zones from FTP percentages
- Validate with workout completion quality
- Retest FTP every 6-8 weeks
Using Zones in Training
Zone 2 (Endurance) rides:
- Set HR alert at Zone 2 ceiling
- If alert triggers, soft pedal until HR drops
- Monitor HR drift to confirm appropriate intensity
- Should feel easy enough to maintain for hours
Zone 4 (Threshold) intervals:
- Target HR should be achieved within 2-3 minutes of interval start
- Maintain as steady as possible through interval
- Full recovery not necessary between intervals
- Aim to complete all intervals at consistent quality
Zone 5 (VO2max) intervals:
- Allow HR to climb through interval (takes 60-90 seconds to peak)
- Final minute should show HR at 90-95%+ of max
- Recovery until HR drops below 70% max before next interval
Validating Zones With the Apple Health Cycling Analyzer
Your ride data contains the evidence needed to validate your zones. Here’s how to use it:
What the Analyzer Shows
| Metric | Zone Validation Use |
| Average HR | Verify rides were in intended zone |
| Max HR | Confirm max HR calibration from hard efforts |
| HR Drift | Validate Zone 2 calibration |
| Efficiency Factor | Compare efficiency across different intensities |
| Fitness Assessment | Track whether zone-based training is producing adaptation |
Validation Workflow
Weekly check:
- Upload recent rides to the analyzer
- Review efficiency trends across ride types
- Check HR drift on endurance rides
- Note any mismatches between intended and actual intensity
Monthly review:
- Compare efficiency factor trends over 4-week block
- Assess whether zone distribution matches targets
- Look for signs of overreaching (declining efficiency, high drift)
- Adjust zones if patterns suggest miscalibration
Quarterly reassessment:
- Retest LTHR and/or FTP
- Compare new results to previous
- Update zones accordingly
- Reset baseline in analyzer
Quick Reference: Zone Troubleshooting
| Problem | Data Evidence | Solution |
| Zone 2 feels too hard | HR drift >10%, can’t talk comfortably | Lower Zone 2 ceiling by 5-10 bpm |
| Zone 2 feels too easy | HR drift minimal, feels like walking pace | Raise Zone 2 ceiling by 5-10 bpm |
| Can’t complete threshold intervals | HR spikes immediately, can’t sustain | FTP/LTHR overestimated; retest |
| Threshold intervals feel easy | HR never reaches Zone 4, feels like tempo | FTP/LTHR underestimated; retest |
| No fitness improvement | Efficiency flat over weeks | Zones wrong or distribution imbalanced |
| Constant fatigue | Efficiency declining, resting HR elevated | Zones too low; every ride is harder than intended |
| HR seems random | High variability even on steady efforts | Inconsistent pacing; focus on steady intensity |
Key Takeaways
✓ Generic formulas are starting points, not answers. “220 minus age” can be wrong by 20+ bpm.
✓ LTHR is more useful than max HR for setting heart rate zones.
✓ FTP-based power zones are more objective than heart rate but require a power meter.
✓ Validate zones with real ride data: HR drift, talk test, efficiency factor, and workout completion quality.
✓ Zone distribution matters: Aim for 75-80% easy, minimal Zone 3, 15-20% hard.
✓ Wrong zones = wrong training. Time spent in unintended zones produces unintended adaptations.
✓ Reassess regularly: Retest threshold every 6-8 weeks as fitness changes.
Stop Guessing, Start Validating
Your zones are the foundation of every structured workout. If they’re wrong, everything built on top is compromised.
Export your Apple Health data. Upload your rides to the Apple Health Cycling Analyzer. Look at your HR drift on easy rides. Compare efficiency across intensities. Let the data tell you whether your zones reflect reality.
Training by numbers only works when the numbers are right.
Leave a Reply