
You’ve experienced it. Everyone who trains indoors has.
Outside, you cruise at 28 km/h with a heart rate of 145 bpm. It feels sustainable. You could ride for hours.
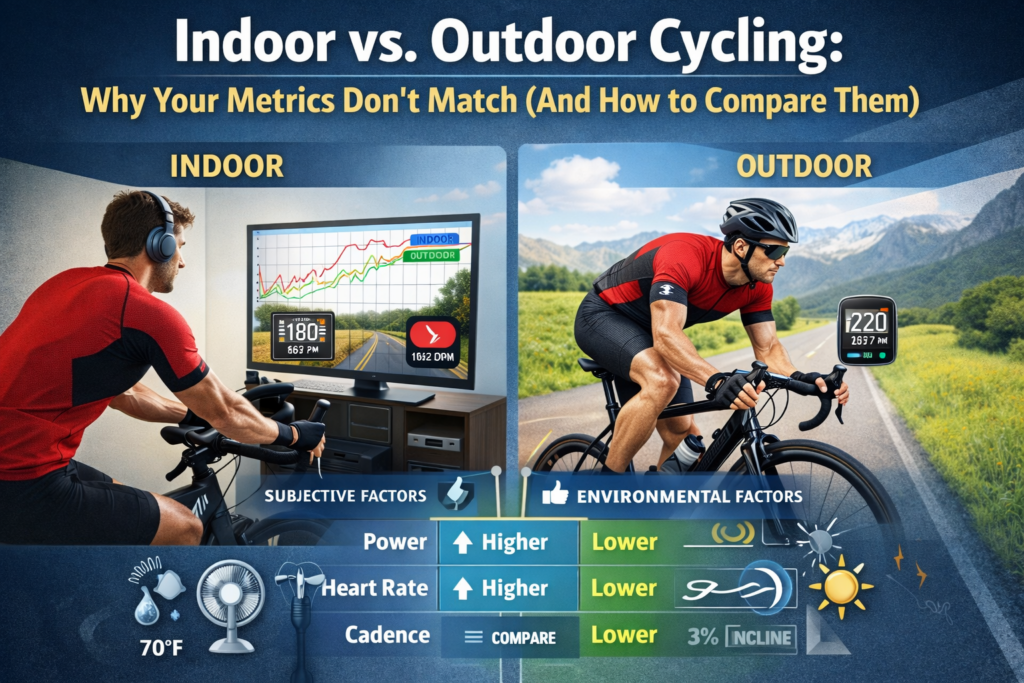
Inside, on the trainer, you’re grinding away at what should be the same effort. Your heart rate reads 145 bpm. But your power output is lower. Or if you’re matching outdoor power, your heart rate is 10 beats higher. Either way, it feels significantly harder.
You finish the indoor session drenched in sweat, questioning everything. Is the trainer broken? Is your heart rate monitor lying? Are you losing fitness?
None of the above.
Indoor and outdoor cycling are physiologically different activities. The metrics don’t match because the environments create fundamentally different demands on your body. Understanding why – and knowing how to compare data between environments – transforms confusion into actionable insight.
Why Indoor Cycling Feels Harder: The Science
Multiple factors combine to make indoor training more demanding at equivalent intensity. Let’s break them down.
Factor 1: Thermoregulation (The Big One)
The problem: Your body is an engine that’s roughly 20-25% efficient. For every 100 watts of energy you produce, only 20-25 watts become pedal power. The rest becomes heat.
Outdoors, you have a built-in cooling system:
- Convective cooling: Air flowing over your body at 25+ km/h removes heat rapidly
- Evaporative cooling: Sweat evaporates efficiently in moving air
- Environmental variation: Descents, stops, and shade provide cooling opportunities
Indoors, that cooling system fails:
- Minimal airflow: Even with a fan, air movement is a fraction of outdoor riding
- Sweat accumulates: Drips rather than evaporates, reducing cooling efficiency
- Heat builds: Room temperature rises; your microclimate becomes a sauna
- No breaks: Continuous pedaling with no coasting or descending
The physiological response:
When core temperature rises, your body diverts blood from working muscles to the skin for cooling. This means:
- Less oxygen delivery to muscles
- Higher heart rate to maintain cardiac output
- Earlier fatigue at the same power output
- Increased perceived effort
Research shows: Indoor cycling at the same power output produces heart rates 5-15 bpm higher than outdoor cycling, primarily due to thermal stress.
| Condition | HR at 200 watts | Core Temp After 60 min |
| Outdoor (20°C, 25 km/h) | 145 bpm | 38.2°C |
| Indoor (20°C, small fan) | 155 bpm | 38.9°C |
| Indoor (20°C, no fan) | 162 bpm | 39.4°C |
That 10-17 bpm difference isn’t fitness – it’s physics.
Factor 2: Lack of Inertia and Momentum
The problem: Outdoors, once you’re moving, momentum helps. Your bike wants to keep rolling. Small variations in power output are smoothed by inertia.
On most indoor trainers:
- No flywheel momentum: Every pedal stroke starts from near-zero assistance
- Constant resistance: No recovery from micro-coasts
- No terrain variation: Flat road means constant muscular engagement
- Fixed position: No bike movement, weight shifts, or position changes
The result: Indoor cycling requires more consistent muscular engagement. There’s no “free speed” from momentum. Your muscles work harder even when power output is identical.
Smart trainers partially address this with heavier flywheels and “road feel” simulation, but the difference persists.
Factor 3: Drivetrain Differences
The problem: Power meters measure at specific points in the drivetrain. Where measurement happens affects the number you see.
| Power Meter Location | What It Measures |
| Pedals | Force at pedal interface |
| Crank arms | Torque at crank |
| Chainring (spider) | Power entering drivetrain |
| Hub | Power after chain/cassette losses |
| Trainer (direct drive) | Power at trainer resistance unit |
Drivetrain losses outdoors: 3-5% of power is lost through chain friction, derailleur pulleys, and bearing resistance before reaching the rear wheel.
Smart trainer measurement: Direct-drive trainers measure at the resistance unit – after your drivetrain losses from chain and cassette.
The math:
If you produce 250 watts at the pedals:
- Outdoor hub power: ~240 watts (after ~4% drivetrain loss)
- Direct-drive trainer reading: ~240 watts
Your pedal-based power meter reads 250w outdoors. Your trainer reads 240w. Same effort, different numbers.
If you use a crank-based power meter outdoors but rely on trainer power indoors, expect a 3-8% discrepancy that has nothing to do with fitness.
Factor 4: Bike Fit and Position Differences
The problem: Your indoor setup probably isn’t identical to your outdoor position.
Common discrepancies:
| Variable | Impact |
| Saddle height | 5mm difference significantly affects power production |
| Reach | Different stem/bars alter hip angle and breathing |
| Saddle angle | Affects pelvic stability and comfort |
| Cleat position | May differ between bike shoes |
| Bike movement | Outdoor bikes sway; fixed trainers don’t |
The fixed trainer problem: On a fixed trainer (wheel-on or direct-drive without rocker plate), your bike can’t move laterally. This eliminates natural sway during pedaling, forcing different muscle recruitment patterns and often increasing discomfort.
The result: Different position = different muscles emphasized = different efficiency = different metrics.
Factor 5: Psychological and Motivational Factors
Don’t underestimate the mental component.
Outdoor advantages:
- Scenery changes maintain engagement
- Social riding adds motivation
- Goals are visible (town signs, segment starts, the top of the climb)
- Danger/traffic keeps you alert
- Variable terrain breaks monotony
Indoor challenges:
- Staring at a wall or screen for hours
- No external accountability
- Easy to quit – just stop pedaling
- Time perception distorts (indoor minutes feel longer)
- Boredom accumulates fatigue
Research confirms: Psychological factors can affect perceived effort by 5-10%, independent of physiological variables. An indoor hour genuinely feels longer and harder than an outdoor hour at identical intensity.
Factor 6: Air Density and Resistance
A subtle but real factor for outdoor riding.
Outdoors: Air resistance increases exponentially with speed. At 30 km/h, roughly 80% of your effort fights air resistance. This creates a natural feedback loop – push harder, go faster, feel more air cooling, which partially offsets thermal load.
Indoors: Trainer resistance is typically linear or follows a programmed curve. The cooling benefit of higher speed doesn’t exist.
Quantifying the Difference: How Much Harder Is Indoor?
Based on research and practical observation, here are typical indoor vs. outdoor discrepancies:
| Metric | Indoor vs. Outdoor | Primary Cause |
| Heart rate | 5-15 bpm higher indoors | Thermoregulation |
| Power (same RPE) | 5-10% lower indoors | Heat + psychology |
| RPE (same power) | 1-2 points higher indoors | All factors combined |
| Time to exhaustion | 15-25% shorter indoors | Cumulative stress |
| Efficiency Factor | 10-20% lower indoors | HR up, speed meaningless |
Individual variation is significant. Some cyclists see minimal difference with excellent cooling setups. Others see dramatic gaps. Your personal indoor-outdoor offset is what matters.
How to Normalize Data Between Environments
Given these differences, how do you meaningfully compare indoor and outdoor training?
Option 1: Accept Separate Baselines
The simplest approach: don’t directly compare.
Maintain separate expectations:
| Environment | Your FTP | Zone 2 HR | Threshold HR |
| Outdoor | 250w | 130-145 bpm | 168 bpm |
| Indoor | 235w | 138-152 bpm | 175 bpm |
Train to the appropriate baseline for each environment. Track progress within each category separately.
Pros: Simple, accounts for real differences
Cons: Harder to assess overall fitness trajectory
Option 2: Apply Adjustment Factors
Calculate your personal indoor-outdoor offset, then apply it when comparing.
How to find your offset:
- Perform identical test efforts in both environments (same duration, same RPE target)
- Compare heart rate and/or power
- Calculate the percentage difference
Example:
| Metric | Outdoor Test | Indoor Test | Offset |
| 20-min power | 245w | 228w | -7% |
| Avg HR at 200w | 152 bpm | 163 bpm | +7% |
When comparing indoor rides to outdoor rides, adjust by your offset:
- Indoor 228w effort ≈ outdoor 245w effort
- Indoor 163 bpm ≈ outdoor 152 bpm
Pros: Enables cross-environment comparison
Cons: Offset varies with conditions (room temp, fan setup, fatigue)
Option 3: Normalize via RPE
Rate of Perceived Effort provides a cross-environment anchor.
| RPE | Description | Outdoor HR | Indoor HR |
| 3 | Easy, conversational | 125 bpm | 132 bpm |
| 5 | Moderate, sustainable | 148 bpm | 158 bpm |
| 7 | Hard, threshold | 165 bpm | 174 bpm |
| 9 | Very hard, unsustainable | 178 bpm | 185 bpm |
If an outdoor ride at RPE 5 produces 148 bpm, and an indoor ride at RPE 5 produces 158 bpm, those efforts are equivalent – regardless of what the heart rate numbers suggest.
Pros: Accounts for all factors including psychological
Cons: RPE is subjective and requires calibration
Option 4: Use Efficiency Factor With Context
Efficiency Factor (output ÷ HR) can compare environments when interpreted correctly.
The challenge: Indoor cycling often lacks meaningful speed data. Without speed, traditional EF (speed ÷ HR) doesn’t work.
Solutions:
If you have power data:
Power-based EF = Average Power ÷ Average HR
This works identically indoors and outdoors. Compare your power-based EF across environments to quantify the thermal/psychological penalty.
Example:
- Outdoor: 210w at 148 bpm → EF = 1.42
- Indoor: 195w at 158 bpm → EF = 1.23
- Indoor efficiency penalty: ~13%
If you only have HR data:
Compare HR-based metrics that don’t require speed:
- HR drift during steady efforts
- Time in HR zones
- HR recovery between intervals
Coming in a future version: Automatic indoor vs. outdoor ride detection with environment-specific efficiency tracking and adjustment recommendations.
Practical Strategies to Minimize the Gap
You can’t eliminate indoor-outdoor differences, but you can reduce them.
Optimize Your Cooling Setup
The biggest lever you have.
| Cooling Level | Setup | Expected Impact |
| Minimal | No fan | +15-20 bpm over outdoor |
| Basic | Single floor fan | +10-15 bpm over outdoor |
| Good | Large fan + open window | +5-10 bpm over outdoor |
| Excellent | Multiple industrial fans, cool room, minimal clothing | +3-7 bpm over outdoor |
| Professional | Air-conditioned pain cave with wind simulation | +0-5 bpm over outdoor |
Practical recommendations:
- Use the biggest fan possible. Industrial fans outperform small desk fans dramatically.
- Position fan to hit torso and face. Core and head are primary heat sources.
- Keep room cool. 16-18°C (60-65°F) is ideal. Open windows in winter.
- Minimize clothing. Every layer traps heat.
- Pre-cool the room. Start with cold environment before body heat builds.
- Consider a second fan. One from front, one from side.
Match Your Bike Position
Reduce biomechanical differences:
- Measure and replicate saddle height exactly
- Match reach and stack height
- Use the same shoes and cleats
- Consider a rocker plate for natural bike movement
- If using a dedicated trainer bike, get a professional fit
Address the Psychology
Make indoor training more engaging:
| Strategy | Benefit |
| Structured workouts | Focus on intervals, not duration |
| Virtual platforms (Zwift, etc.) | Visual engagement + social elements |
| Entertainment | Music, podcasts, shows during easy efforts |
| Shorter sessions | 60-75 min max; quality over quantity |
| Clear goals | Power targets, not vague “ride easy” |
Use Consistent Measurement
If comparing indoor and outdoor data:
- Use the same power meter in both environments (pedal-based works on trainer and outdoor bike)
- Or accept trainer power may read 3-8% lower than outdoor measurements
- Use the same heart rate monitor with consistent positioning
How the Apple Health Cycling Analyzer Helps
Current Functionality
Apple Health tags workouts by type, distinguishing between:
- Outdoor Cycling: Full data including GPS, speed, distance, elevation
- Indoor Cycling: Limited data – typically HR, duration, and calories only
When you upload your data, the analyzer processes both types but handles them differently:
Outdoor rides:
- Full efficiency analysis (speed ÷ HR)
- VAM and climbing metrics
- HR drift analysis
- Fitness progress assessment
Indoor rides (HR data only):
- HR drift analysis (cardiovascular stability)
- Average and max HR tracking
- Duration and training load contribution
- Limited efficiency analysis due to missing speed/power
What to Look For
For outdoor rides:
Review your efficiency factor trends, HR drift patterns, and fitness assessments as usual.
For indoor rides:
Focus on:
- HR drift during steady efforts: Still indicates aerobic fitness and pacing quality
- Avg HR for similar duration rides: Track whether indoor efforts are becoming easier (lower HR) over time
- Training load contribution: How indoor volume contributes to overall load
Comparing environments:
When viewing your ride history, note patterns:
- Do indoor rides consistently show higher average HR than outdoor rides of similar duration?
- Is your HR drift worse indoors than outdoors?
- Are indoor-heavy training weeks associated with higher fatigue?
Coming in a future version: Automatic indoor/outdoor environment tagging with comparative analysis showing your personal efficiency offset between environments, and adjusted fitness assessments that account for environmental context.
Building Your Personal Indoor-Outdoor Profile
Step 1: Establish Outdoor Baselines
Before comparing environments, know your outdoor metrics:
- Upload 8-10 recent outdoor rides to the analyzer
- Note your typical efficiency factor range
- Identify your average HR for endurance rides
- Record HR drift on 60-90 minute steady efforts
Step 2: Test Indoor Performance
Perform equivalent efforts indoors:
- Steady 60-minute ride at “outdoor Zone 2” perceived effort
- Record average HR and HR drift
- Note perceived effort (RPE) throughout
- If possible, use same power meter as outdoor
Step 3: Calculate Your Offset
Compare indoor and outdoor results:
| Metric | Outdoor | Indoor | Your Offset |
| Avg HR (steady effort) | ___bpm | ___bpm | +___bpm |
| HR drift (60 min) | ___% | ___% | +/- ___% |
| RPE at Zone 2 HR | ___ | ___ | +/- ___ |
Step 4: Apply Context to Future Analysis
When reviewing data:
- Indoor ride with HR 8 bpm higher than outdoor equivalent? Expected – not fitness loss.
- Indoor HR drift significantly higher than outdoor? Consider better cooling.
- Indoor RPE much higher than outdoor at same HR? Normal – don’t force outdoor numbers indoors.
Workout-Specific Considerations
Endurance/Zone 2 Rides
The challenge: Long indoor Zone 2 sessions are mentally brutal and thermally challenging.
Recommendations:
- Limit indoor endurance rides to 90-120 minutes maximum
- Accept 5-10 bpm higher HR than outdoor equivalent
- Prioritize cooling above all else
- Use entertainment to manage boredom
- Consider two shorter sessions instead of one long one
Threshold Intervals
The challenge: Heat buildup during sustained hard efforts.
Recommendations:
- Expect indoor threshold HR 5-8 bpm higher
- Or accept 5-7% lower power at same HR
- Allow extra recovery between intervals (HR drops slower indoors)
- Maximum cooling during rest periods
VO2max Intervals
The challenge: Maximal efforts in poor cooling conditions.
Recommendations:
- These actually work well indoors – short duration limits heat accumulation
- Full recovery between intervals (HR must drop adequately)
- Room temperature is critical – keep it cold
- Indoor VO2max intervals can match outdoor quality with proper setup
Recovery Rides
The challenge: Easy indoor spinning often isn’t easy enough.
Recommendations:
- Reduce power/speed targets significantly for indoor recovery
- HR will still be elevated; focus on RPE staying very low
- Consider whether outdoor recovery ride is more beneficial
- Keep duration short (30-45 minutes)
Compare Your Indoor and Outdoor Performance
Stop wondering why your indoor numbers don’t match your outdoor results. The difference is real, measurable, and manageable.
- Export your Apple Health data including both indoor and outdoor rides
- Upload to the Apple Health Cycling Analyzer for environment-aware analysis
- Compare HR patterns between indoor and outdoor efforts
- Calculate your personal offset using equivalent-effort sessions
- Apply appropriate baselines for each training environment
Your indoor trainer isn’t lying. Your fitness isn’t declining. The environments are simply different – and now you know how to account for it.
Leave a Reply