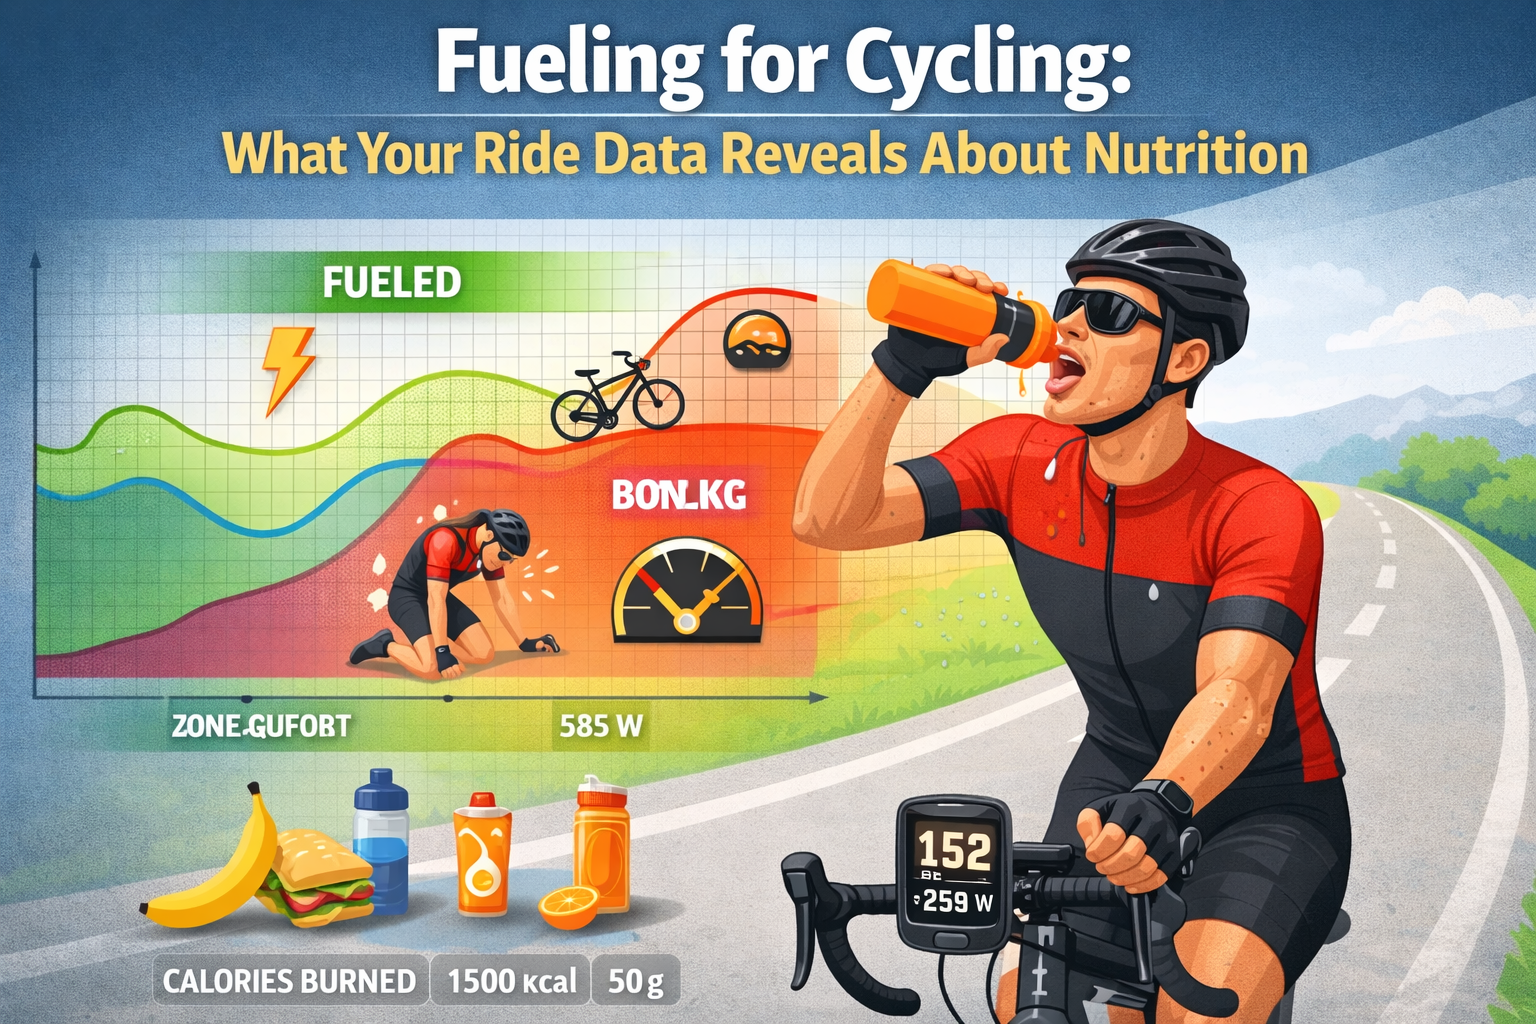
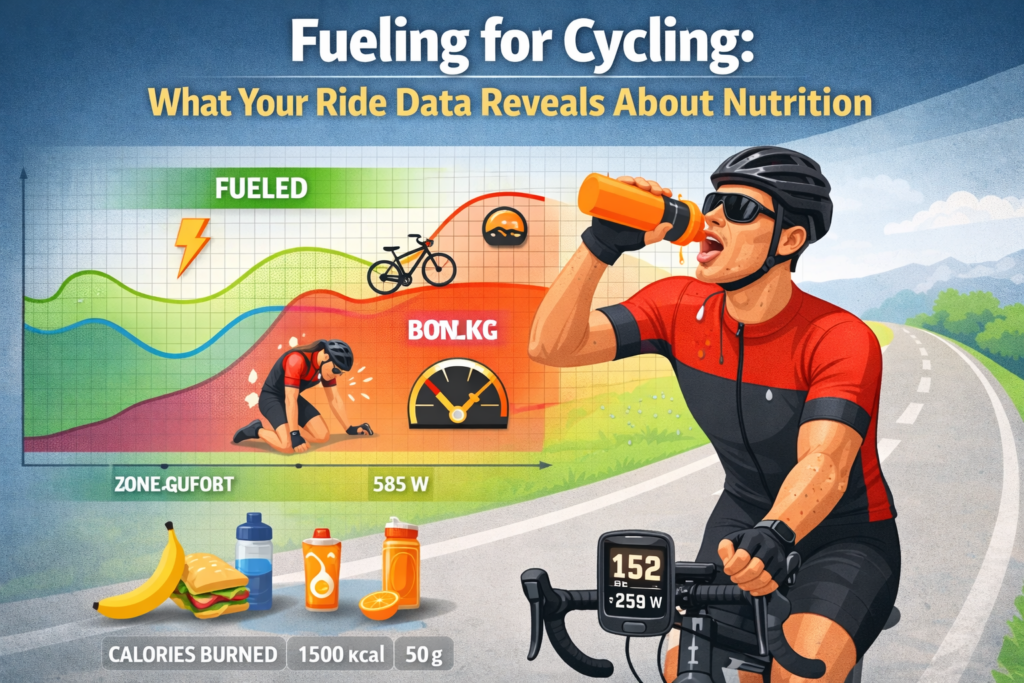
You’ve seen it in your numbers. Maybe you didn’t recognize it at the time.
The first two hours felt great. Heart rate stable. Speed consistent. Efficiency factor right where it should be.
Then, somewhere in hour three, everything changed. Speed dropped. Heart rate dropped with it – not because you were going easy, but because your body couldn’t sustain the effort. Efficiency collapsed. The final hour became survival.
That’s not a fitness problem. That’s a fueling problem.
And it shows up clearly in your ride data – if you know what to look for.
This guide explains the science of cycling nutrition, how to recognize fueling failures in your metrics, and how to build a nutrition strategy that keeps your data consistent from start to finish.
How Fueling Affects Your Cycling Metrics
Your body runs on fuel. When fuel runs low, performance collapses – and your data tells the story.
The Energy Systems at Play
| Duration | Primary Fuel | Limitation |
| 0-10 seconds | ATP/Creatine phosphate | Very limited stores |
| 10 sec – 2 min | Glycogen (anaerobic) | Produces lactate, unsustainable |
| 2 min – 2 hours | Glycogen (aerobic) | ~90-120 min of hard riding |
| 2+ hours | Fat + glycogen mix | Fat burning limited by intensity |
The critical insight: Your glycogen stores are finite. A trained cyclist stores approximately 400-500g of glycogen in muscles and liver – enough for 90-120 minutes of moderate-to-hard riding.
After that, you’re dependent on:
- Fat oxidation (slower, intensity-limited)
- Incoming carbohydrates (what you eat during the ride)
If neither is sufficient, performance craters.
What Glycogen Depletion Looks Like in Data
The bonk has a distinct data signature:
| Metric | Normal Ride | Glycogen Depleted |
| Speed/Power | Stable throughout | Declining despite effort |
| Heart Rate | Stable or slight drift | Declining (can’t generate output) |
| Efficiency Factor | Stable | Collapsing |
| RPE | Appropriate to effort | Disproportionately high |
The key pattern: When both heart rate AND speed/power decline together in the latter portion of a ride, fueling is often the culprit. Your body literally cannot produce the cardiac output because it lacks substrate.
The Science of Cycling Nutrition
Carbohydrates: Your Primary Fuel
For cycling performance, carbohydrates are king. Fat provides energy at lower intensities, but anything above Zone 2 requires significant carbohydrate contribution.
Carbohydrate oxidation rates:
| Intensity | Carb Burning Rate | Glycogen Duration |
| Zone 2 (easy) | 30-40g/hour | 4-5+ hours |
| Zone 3 (tempo) | 50-70g/hour | 2-3 hours |
| Zone 4 (threshold) | 70-90g/hour | 1.5-2 hours |
| Zone 5 (VO2max) | 90-120g/hour | <1 hour |
The math problem: If you’re burning 60g of carbs per hour and only consuming 30g per hour, you’re in deficit. Eventually, the tank empties.
Gut Absorption Limits
Your intestines can only absorb carbohydrates so fast:
| Carb Type | Max Absorption Rate |
| Glucose only | ~60g/hour |
| Glucose + fructose (2:1 ratio) | ~90g/hour |
| Trained gut (glucose + fructose) | Up to 120g/hour |
Practical implication: Consuming more than your gut can absorb causes GI distress without performance benefit. Match intake to absorption capacity.
The Role of Fat
Fat provides abundant energy but with limitations:
Advantages:
- Nearly unlimited stores (even lean cyclists have 30,000+ calories of fat)
- Sustainable for very long durations
- Spares glycogen at lower intensities
Limitations:
- Oxidation rate limited to ~60g/hour maximum
- Cannot fuel high-intensity efforts
- Requires oxygen – not available at near-max efforts
The crossover point: As intensity increases, your body shifts from fat to carbohydrate burning. At threshold and above, you’re almost entirely carb-dependent.
Recognizing Fueling Failures in Your Data
Pattern 1: The Classic Bonk
What happened: Glycogen depleted, fat oxidation can’t keep up, blood sugar crashes.
Data signature:
| Segment | Speed | Heart Rate | Efficiency |
| Hours 1-2 | 28 km/h | 148 bpm | 1.89 |
| Hour 3 | 25 km/h | 142 bpm | 1.76 |
| Hour 4 | 21 km/h | 132 bpm | 1.59 |
The telltale: Speed AND heart rate declining together. You want to go harder, but your body can’t produce the output.
Other symptoms:
- Sudden weakness, lightheadedness
- Difficulty concentrating
- Emotional instability (irritability, despair)
- Loss of coordination
Pattern 2: The Slow Fade (Partial Depletion)
What happened: Not a complete bonk, but insufficient fueling causes gradual performance decline.
Data signature:
| Segment | Speed | Heart Rate | HR Drift |
| First half | 27 km/h | 145 bpm | Baseline |
| Third quarter | 26 km/h | 148 bpm | +2% |
| Final quarter | 24 km/h | 146 bpm | Stable but output down |
The telltale: Progressive speed decline with relatively stable (or slightly elevated) heart rate. Body is working harder to produce less output.
Pattern 3: The Intensity Ceiling
What happened: Enough fuel for steady riding, but no capacity for hard efforts.
Data signature:
- Steady-state metrics look normal
- Unable to respond to climbs, surges, or attacks
- HR doesn’t reach typical high values during hard efforts
- “Legs just weren’t there” feeling
The telltale: Your max HR during hard efforts is lower than usual. The body can’t generate peak output without glycogen.
Pattern 4: Dehydration-Induced Drift
What happened: Insufficient fluid intake causes blood volume to decrease, HR to rise.
Data signature:
| Segment | Speed | Heart Rate | HR Drift |
| Hour 1 | 28 km/h | 145 bpm | Baseline |
| Hour 2 | 28 km/h | 152 bpm | +5% |
| Hour 3 | 27 km/h | 158 bpm | +9% |
The telltale: Speed remains relatively stable, but heart rate progressively climbs. Same output, increasing cardiac cost.
The physiology: Dehydration reduces blood plasma volume. Heart must beat faster to deliver the same oxygen. Eventually, performance falls as the system strains.
Building Your Fueling Strategy
Before the Ride: Topping Off the Tank
Timing matters:
| When | What | Why |
| 3-4 hours before | Large meal (100-150g carbs) | Full digestion, liver glycogen topped |
| 1-2 hours before | Smaller snack (30-50g carbs) | Top-off without GI discomfort |
| 15-30 min before | Optional small amount (15-25g) | Immediate availability |
Pre-ride meal examples:
| Meal | Carbs | Notes |
| Oatmeal + banana + honey | ~80g | Easy to digest, sustained release |
| Toast + peanut butter + jam | ~60g | Quick to prepare |
| Rice + eggs | ~50g | Lower fiber, gentle on stomach |
| Pasta (moderate portion) | ~70g | Classic choice, avoid heavy sauces |
What to avoid:
- High fat meals (slow digestion)
- High fiber (GI distress risk)
- Unfamiliar foods (not race/hard ride day)
- Large meals within 2 hours of start
During the Ride: Maintaining the Supply
Fueling guidelines by duration:
| Ride Duration | Fueling Needed | Carbs/Hour |
| <60 minutes | Usually none | 0-30g optional |
| 60-90 minutes | Optional/moderate | 30-40g |
| 90-150 minutes | Recommended | 40-60g |
| 150+ minutes | Essential | 60-90g |
| 3+ hours (hard) | Maximum | 80-120g (trained gut) |
When to start: Begin fueling at 30-45 minutes, not when you feel hungry. By the time you feel depleted, it’s too late – absorption takes 15-30 minutes.
Fueling sources comparison:
| Source | Carbs | Pros | Cons |
| Energy gels | 20-30g | Concentrated, fast | Can cause GI issues, need water |
| Energy bars | 30-45g | Sustained release, satisfying | Harder to eat at intensity |
| Sports drink | 30-60g/bottle | Hydration + fuel combined | May not match needs separately |
| Bananas | 25-30g | Natural, easy to digest | Bulky, less precise |
| Rice cakes | 20-30g | Savory option, real food | Requires preparation |
| Dates | 15-20g each | Natural sugars, compact | Sticky, can be too sweet |
Practical approach:
- Set timer for every 20-30 minutes
- Consume 20-30g carbs each interval
- Alternate between sweet and savory to prevent flavor fatigue
- Practice your fueling strategy on training rides, not events
The Glucose-Fructose Advantage
For rides demanding >60g/hour intake, use products with multiple carbohydrate sources.
Why it works: Glucose and fructose use different intestinal transporters. Combining them allows higher total absorption.
Target ratio: 2:1 glucose to fructose (some products use 1:0.8)
Products typically using multiple transporters:
- Most commercial energy gels and drinks
- Check labels for maltodextrin (glucose source) + fructose
Hydration: The Other Half of the Equation
Dehydration degrades performance even when carbohydrate intake is adequate.
Sweat Rate Reality
| Conditions | Typical Sweat Rate | Fluid Need/Hour |
| Cool (15°C), moderate effort | 500-700 ml/hour | 400-600 ml |
| Moderate (20-25°C), hard effort | 800-1200 ml/hour | 600-900 ml |
| Hot (30°C+), any effort | 1000-1500+ ml/hour | 750-1200 ml |
You cannot fully replace sweat losses during exercise. The gut can only absorb 600-800 ml/hour maximum. In hot conditions, you’re fighting a losing battle – minimize the deficit rather than eliminating it.
Dehydration Performance Impact
| Dehydration Level | Performance Impact |
| 1% body weight | Minimal – often unnoticed |
| 2% body weight | ~10% performance decline |
| 3% body weight | ~20% performance decline, impaired thermoregulation |
| 4%+ body weight | Significant health risk, severe impairment |
For a 70kg cyclist: 2% dehydration = 1.4kg fluid loss = ~1.5 liters
Electrolytes: When They Matter
Plain water is sufficient for rides under 90 minutes in moderate conditions.
When to add electrolytes:
| Factor | Electrolyte Need |
| Duration >90 minutes | Recommended |
| Hot conditions | Recommended |
| Heavy sweater | Essential |
| Salty sweat (white residue) | Essential |
| History of cramping | Recommended |
Key electrolytes:
| Electrolyte | Role | Typical Need/Hour |
| Sodium | Fluid balance, nerve function | 300-600mg |
| Potassium | Muscle function | 50-100mg |
| Magnesium | Muscle contraction | 10-30mg |
Practical approach: Use electrolyte drink mix or tablets in one bottle, plain water or carb drink in another.
Post-Ride: Recovery Nutrition
What you eat after riding affects your next ride’s performance.
The Recovery Window
First 30-60 minutes: Glycogen synthesis rate is elevated. Muscles are primed to absorb nutrients.
Target intake:
- Carbohydrates: 1-1.2g per kg body weight
- Protein: 0.3-0.4g per kg body weight
For a 70kg cyclist:
- 70-85g carbohydrates
- 20-30g protein
Recovery Meal Examples
| Meal | Carbs | Protein | Notes |
| Chocolate milk (500ml) | ~50g | ~16g | Quick, convenient, effective |
| Rice + chicken breast | ~60g | ~35g | Complete meal |
| Pasta + meat sauce | ~70g | ~25g | Classic recovery meal |
| Smoothie (banana, berries, protein, oats) | ~60g | ~25g | Easy to consume when not hungry |
| Eggs + toast + orange juice | ~45g | ~20g | Breakfast option |
When Recovery Nutrition Matters Most
High priority (don’t skip):
- After rides >2 hours
- After high-intensity sessions
- When training again within 24 hours
- During heavy training blocks
Lower priority (flexibility okay):
- Easy recovery rides <60 minutes
- Rest day before next session
- If next meal is within 2 hours anyway
Using Your Data to Refine Fueling Strategy
Pre/Post Comparison Method
Protocol:
- Complete similar rides with different fueling approaches
- Compare late-ride metrics between approaches
- Identify which strategy produces better data consistency
What to compare:
| Metric | Well-Fueled Target | Under-Fueled Sign |
| HR Drift | <5% over ride | >8% (especially if dehydrated) |
| Late-ride EF | Stable vs. early ride | Declining >10% |
| Speed consistency | <5% decline | >10% decline in final third |
| HR + Speed together | Stable | Both declining simultaneously |
Tracking Fueling in Your Training Log
Record fueling data alongside ride data:
| Field | Why It Matters |
| Pre-ride meal | Correlate with early-ride feel |
| During-ride intake (g carbs) | Compare to performance sustainability |
| Fluid intake | Correlate with HR drift |
| Conditions (temp, humidity) | Context for hydration needs |
| Late-ride feel | Subjective check against data |
Over time, patterns emerge:
- “When I consume <40g/hour on 3+ hour rides, my efficiency drops >15% in the final hour”
- “My HR drift exceeds 8% when I drink <500ml/hour in temperatures above 25°C”
The Analyzer’s Role
Upload your rides to the Apple Health Cycling Analyzer and examine:
For each long ride:
- Is efficiency factor stable throughout, or declining late?
- Does HR drift stay under 5%, or climb higher?
- Do hard efforts late in the ride show appropriate HR response?
Across multiple rides:
- Which long rides maintained efficiency best?
- What did you do differently (fueling, hydration) on successful rides?
- Do your “fade” rides share common patterns?
Quick Reference: Fueling Cheat Sheet
By Ride Duration
| Duration | Before | During | After |
| <60 min | Normal meal 2-3h prior | Water only | Normal eating |
| 60-90 min | Carb-focused meal 2-3h prior | 0-30g carbs, 500ml fluid | Snack + meal within 2h |
| 90-150 min | 100g+ carbs 3h prior, snack 1h prior | 40-60g/hour, 500-750ml/hour | Recovery meal within 1h |
| 150+ min | Large carb meal 3-4h prior, top-off 1h prior | 60-90g/hour, 500-1000ml/hour | Recovery meal immediately |
Warning Signs During Ride
| Symptom | Likely Cause | Immediate Action |
| Sudden weakness | Glycogen depletion | Consume fast carbs (gel, drink) |
| Difficulty concentrating | Low blood sugar | Eat immediately, reduce intensity |
| Excessive HR rise | Dehydration | Drink, add electrolytes |
| Muscle cramping | Electrolyte imbalance, fatigue | Electrolytes, reduce intensity |
| Nausea | Too much intake or intensity | Reduce both, sip fluids |
| Legs “dead” to hard efforts | Glycogen depleted | Carbs won’t help immediately – ride easy |
Data Patterns Summary
| Pattern | Likely Cause | Prevention |
| HR + speed both declining late | Glycogen depletion | Increase carb intake during |
| HR rising, speed stable | Dehydration | Increase fluid intake |
| Can’t reach high HR on efforts | Glycogen depleted | More carbs, start earlier |
| Late-ride efficiency collapse | Under-fueling overall | Systematic fueling plan |
| GI distress | Too much intake or wrong foods | Reduce volume, train gut |
Fuel the Data You Want to See
Your ride data doesn’t lie. When efficiency collapses in the final hour, when heart rate and speed decline together, when you can’t respond to that climb – the data captures it all.
The fix isn’t more fitness. It’s better fueling.
Build a systematic nutrition strategy. Track what you eat alongside how you ride. Upload your data to the Apple Health Cycling Analyzer and look for patterns. Find the fueling approach that keeps your efficiency stable from the first kilometer to the last.
Your legs can only perform as well as your nutrition allows. Feed them properly, and watch your data improve.
Leave a Reply