You want tools that point to real targets quickly and reliably, whether you’re planning a backyard viewing or mapping faint galaxies from a dark site. I weigh historical methods against modern AI to show when classic star charts still serve and when machine learning gives you clearer, faster results. For most practical stargazing and targeted imaging, AI-powered star maps outperform traditional charts on speed, customization, and handling factors like light pollution, while classic maps remain valuable for teaching, offline reference, and understanding celestial context.
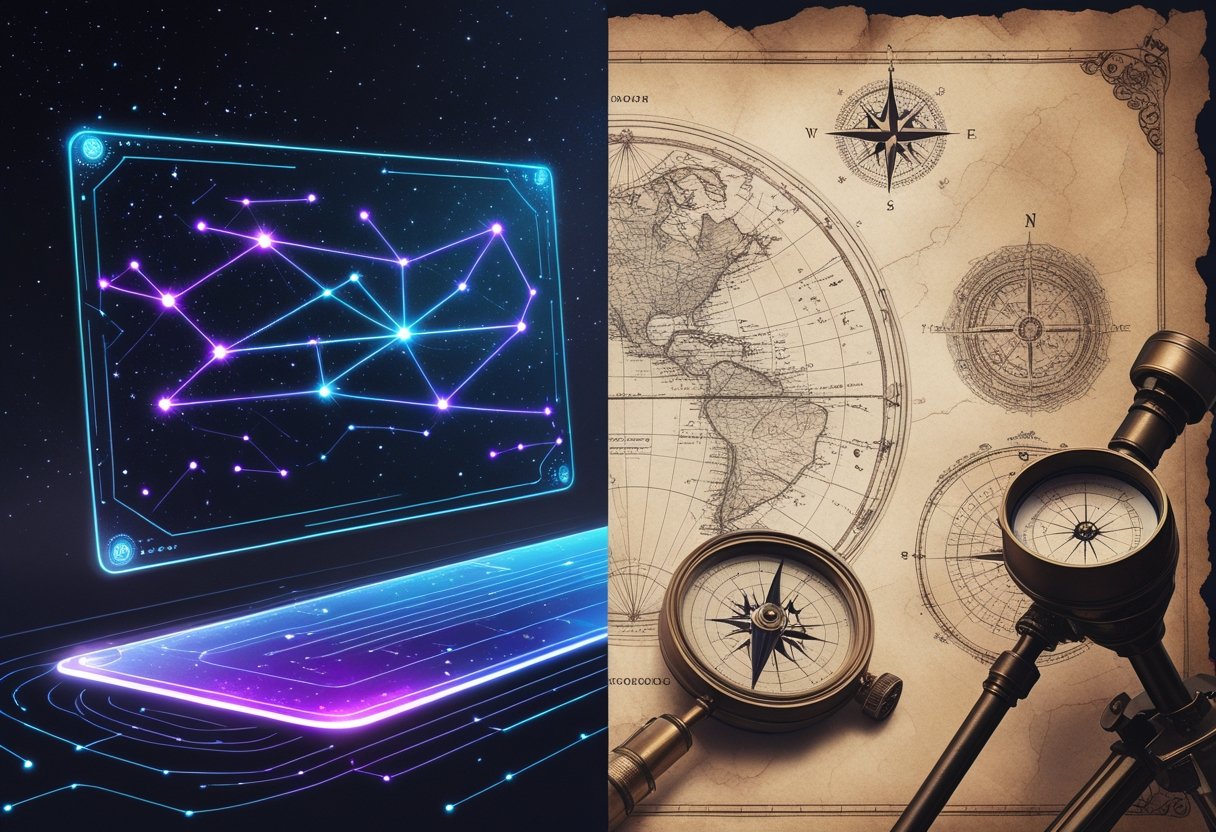
I’ll explain how traditional methods work, why they sometimes fail, and what AI adds—real-time overlays, predictive visibility, and automated object identification—so you can pick the right approach for your telescope, location, and goals. Expect comparisons of reliability, ease of use, and specific use cases such as locating faint galaxies, planning imaging sessions, and navigating light-polluted skies.
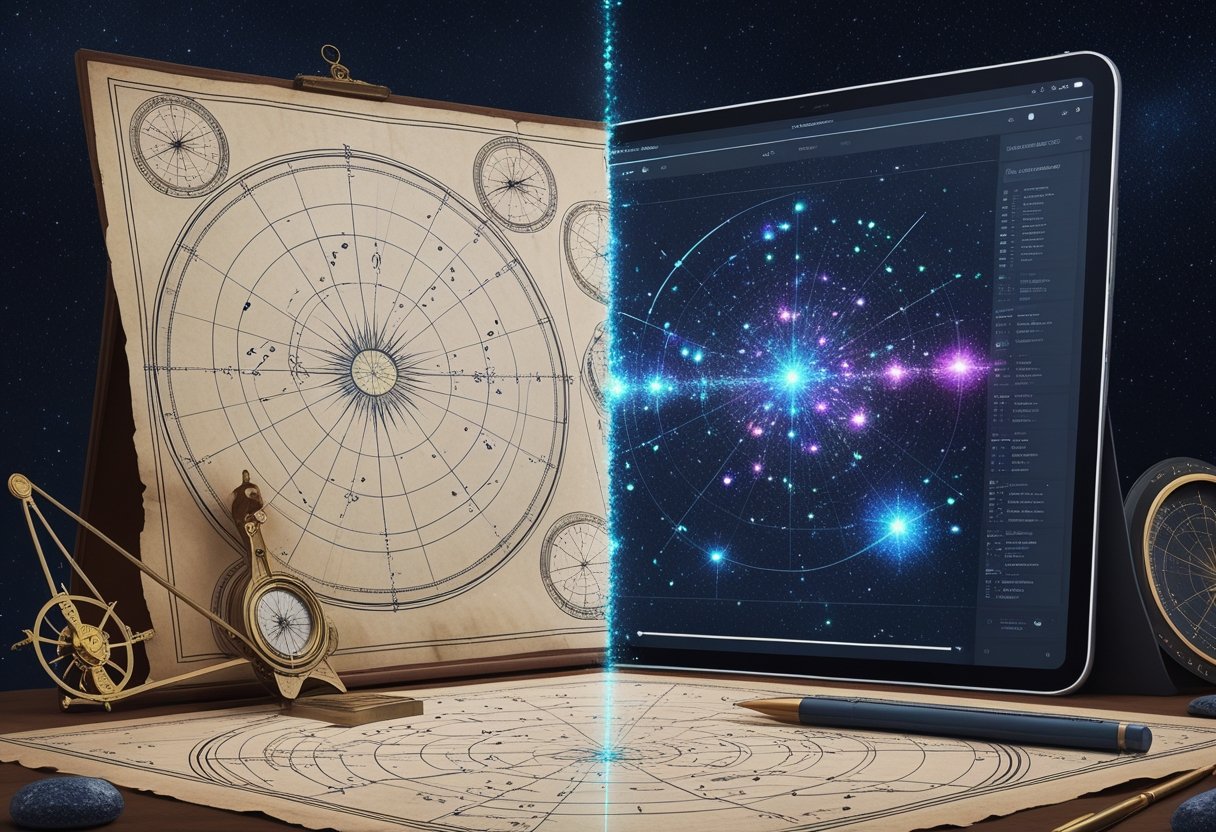
Understanding Star Maps: Traditional vs. AI-Driven Approaches
I compare how conventional star charts are made and used with how modern AI and machine learning generate, annotate, and customize celestial guides. I focus on practical differences for observers, educators, and image processors.
Defining Traditional Star Maps
I mean printed or software-generated star charts that rely on established astronomical catalogs and fixed projection methods. They use the equatorial coordinate system (right ascension and declination), magnitude limits, and standard projections like stereographic or Mercator-style views to preserve angular relationships. Classic tools such as Stellarium and paper atlases let me set date, location, and field of view to produce accurate night-sky layouts.
These maps emphasize human-curated symbol sets: constellation lines, Bayer/Flamsteed labels, and plotted deep-sky objects from catalogs like Messier or NGC. They are deterministic and reproducible, which helps for navigation, teaching, and precise planning of observations with telescopes.
Overview of AI-Powered Star Maps
I describe AI-driven star maps as outputs from machine learning models that ingest catalogs, telescope images, and user parameters to generate visualizations or stylized maps. AI can fuse multi-frame astrophotography, detect transient objects, and auto-annotate features using trained convolutional neural networks. Platforms can produce photorealistic renderings, animated time-lapses, or artistic interpretations on demand.
AI tools speed up tasks such as star/galaxy separation, artifact removal, and magnitude estimation. They also adapt styles and labels to user needs, and can integrate real-time ephemerides. For example, training a model on Gaia data improves positional fidelity while image-fusion models enhance low-signal nebula detail.
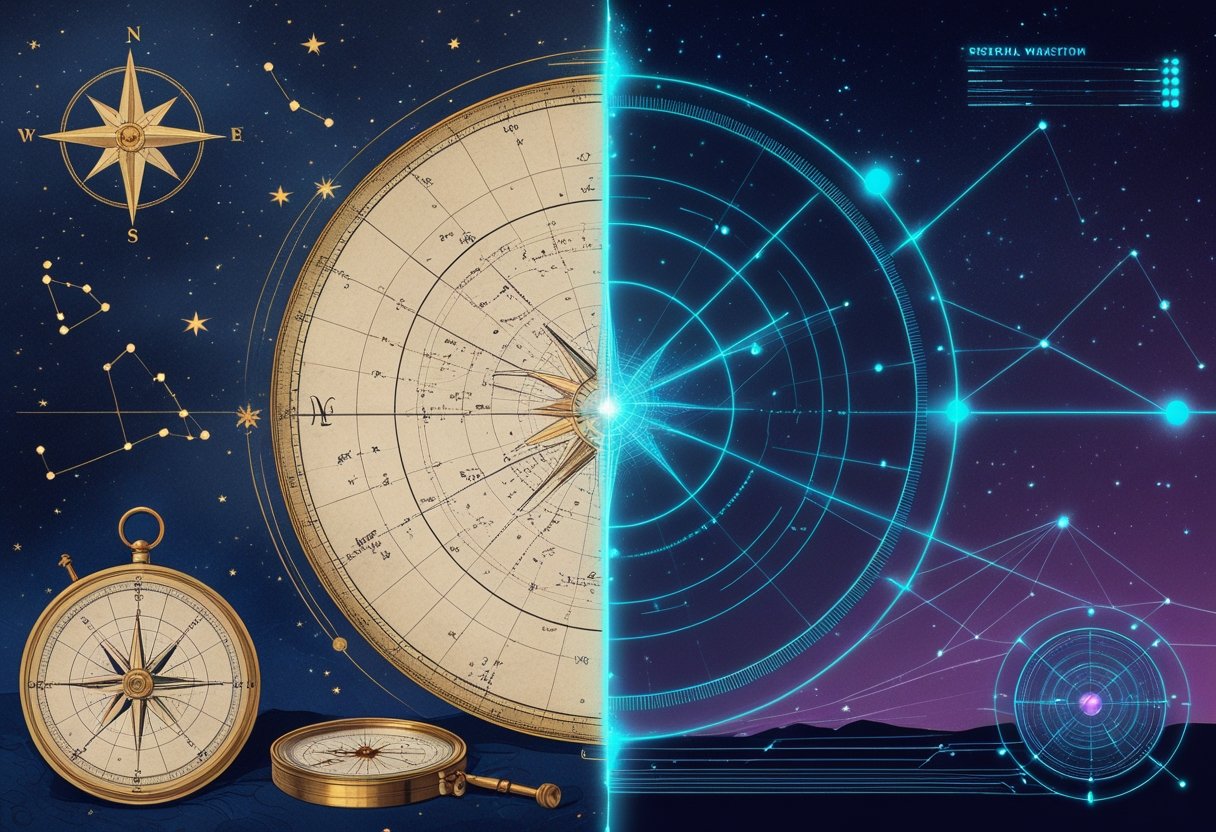
Key Differences Between AI and Traditional Methods
I compare strengths and trade-offs directly. Traditional maps deliver precise coordinate-based charts and standardized labels, ideal for navigation and scientific planning. They remain transparent about data provenance and assumptions, making verification straightforward.
AI approaches excel at customization, speed, and image enhancement—automating annotation, blending multi-wavelength data, and creating interactive animations. However, they can introduce model bias, obscure provenance, or hallucinate faint features if training data is imperfect. Practical differences include latency (AI: seconds to minutes), reproducibility (Traditional: high), and visual style options (AI: broad).
When choosing, I weigh whether you need strict positional accuracy and traceability, or rapid, enhanced, and user-tailored celestial guides that incorporate machine learning. Relevant tools and techniques span star maps, star charts, astrophotography pipelines, and AI-driven catalog integration.
Traditional Star Maps: Methods, History, and Limitations
I trace the arc of star mapping from clay tablets and Ptolemy’s catalogues to hand-drawn celestial atlases and sextant-era charts. You will find how methods evolved, who shaped the catalogs, and why these maps still guided ships and explorers despite clear limits.
Origins and Development of Star Mapping
I start with ancient observations recorded on clay and papyrus, where practical needs—agriculture and ritual—drove accurate tracking of bright stars and seasonal risings. By the 2nd century CE, Ptolemy compiled the Almagest, a systematic star catalog listing magnitudes and ecliptic coordinates that anchored Western cartography for over a millennium.
Medieval and Renaissance observers refined positions using astrolabes and quadrant instruments. Copernicus reframed the cosmos in 1543, altering conceptual frameworks though not immediately improving positional accuracy. Later, telescopes let Galileo detect many fainter stars and resolve nebulae, pushing maps from naked-eye approximations toward instrument-based charts.
I note methods: angular measurement from horizon or pole, manual plotting on spherical projections, and catalog cross-referencing. These produced durable, human-readable constellations and charts, but relied on visual limiting magnitude and manual reduction of observational error.
Notable Figures and Historical Star Catalogs
I highlight Ptolemy’s Almagest as the cornerstone, containing roughly 1,022 stars with positional data that dominated for centuries. Tycho Brahe improved positional precision in the late 16th century with large-scale instruments, producing catalogs that Kepler used to derive orbital laws.
Kepler translated Tycho’s observations into elliptical motion, indirectly improving ephemerides used on star maps. Flamsteed and later Halley expanded northern and southern catalogs; their work fed printed atlases used by navigators and astronomers alike. I emphasize dedicated star catalogs—Flamsteed’s and the later catalogs consolidated into modern collections—that transitioned hand-recorded entries into printed, then machine-readable, lists.
I also point to constellation charts as mnemonic devices: artists and astronomers fused myth and function, aiding star identification but sometimes obscuring precise coordinates behind decorative plates.
The Role of Traditional Maps in Celestial Navigation
I describe how navigators used star charts with sextants and almanacs to fix latitude and estimate longitude before chronometers became widespread. Mariners memorized a handful of key stars and constellations—Polaris for northern latitude, the Southern Cross for southern bearings—and used precomputed star catalogs to convert measured altitudes into position lines.
Traditional maps emphasized bright-star identification, visual magnitude limits, and rising/setting azimuths tied to specific dates. I point out operational limits: weather, human error in sight reduction, and catalog epoch shifts (precession moves coordinates over decades). These limitations forced regular catalog updates and spurred the move to instrument-calibrated and, eventually, digital solutions.
For further reading on the history and artistry of printed celestial atlases, consult Nick Kanas’s treatment of cartography and pictorial star maps.
AI-Powered Star Maps: Technology and Capabilities
I explain how modern systems use artificial intelligence, large astronomical catalogs, and real-time telemetry to detect, classify, and place objects on star maps with high precision.
How AI Identifies and Classifies Celestial Objects
I rely on convolutional neural networks (CNNs) to process telescope images and feature-extract point sources, extended sources, and artifacts.
The CNN filters pixel-level patterns to separate stars from galaxies and nebulae, then passes candidates to a classifier trained on labeled sets from the Gaia mission and the Sloan Digital Sky Survey (SDSS).
Training includes augmentations for noise, seeing, and variable exposure times so the model recognizes faint deep-sky objects across instruments.
I also use ensemble methods combining CNN outputs with photometric and astrometric rules to reduce false positives; this improves precision for crowded fields and faint galaxies.
Classification outputs include object type (star, galaxy, nebula), magnitude estimates, and quality flags that feed downstream mapping and user-facing catalogs.
Integration of Astronomical Databases and Real-Time Data
I merge static star catalogs such as Gaia and SDSS with streaming telemetry from survey telescopes and citizen-science feeders.
This hybrid approach keeps positional accuracy to sub-arcsecond levels for bright stars while ingesting new transient detections within minutes.
I implement a reconciliation layer that cross-matches identifiers, resolves conflicting magnitudes, and updates proper motions before committing entries to the map.
The pipeline tags each entry with provenance—catalog origin, observation timestamp, and confidence—so users can filter by reliability or survey.
For performance, I index spatial data with HEALPix and maintain incremental updates so the star catalog scales to billions of entries without full reprocessing.
Role of Machine Learning in Accurate Mapping
I use ML not only for classification but for calibration, deblending, and predictive interpolation of missing data.
Regression models correct photometric zeropoints between instruments, and CNN-based deblenders separate overlapping sources in dense starfields.
Time-series models flag variable stars and predict visibility windows; probabilistic models estimate positional uncertainty for faint objects.
These ML components reduce systematic biases that used to plague traditional catalogs and improve map completeness for galaxies and nebulae at faint magnitudes.
I validate models against held-out observations from Gaia and SDSS to quantify residual errors before integrating outputs into the public star catalog.
Key Advantages of AI Over Traditional Star Maps
I focus on concrete gains that matter to stargazing enthusiasts, educators, and citizen scientists: faster, more accurate coordinate and object IDs; live adjustments for atmospheric and light conditions; and personalized displays and lesson plans driven by machine learning.
Enhanced Accuracy and Speed in Mapping
I rely on machine learning models to match telescope images to catalogs far faster than manual cross-checking. Neural nets can classify millions of point sources per hour, reducing misidentification of faint objects and improving astrometric precision to sub-arcsecond levels in many pipelines. That matters for stargazing and informal surveys because accurate coordinates let amateur observers and astrobots point precisely and avoid wasted observing time.
I also use AI surrogates to approximate expensive physics calculations when simulating stellar neighborhoods. These surrogates cut runtime dramatically while preserving key features of supernova remnants and cluster dynamics—useful for educators and students who need rapid, realistic datasets for labs. Faster processing increases cadence for transient detection, helping citizen science projects flag real celestial events sooner.
Dynamic Real-Time Updates
I integrate live telemetry, satellite ephemerides, and local sky conditions to produce maps that change on the fly. Unlike static charts, AI-driven maps ingest current light pollution, cloud cover, and the latest survey releases to adjust visibility predictions for targets such as meteor showers and eclipses. Stargazing enthusiasts benefit because I can predict whether a magnitude 6.5 star will be visible from a backyard site tonight.
I feed machine learning models with streaming data from instruments and amateur uploads to refine real-time object classifications. That enables rapid alerts for transient phenomena and helps astrobots retarget autonomously. Educators use these live maps to schedule demonstrations around imminent celestial events, and citizen science platforms can prioritize follow-up observations while the event is still observable.
Improved Accessibility and Personalization
I tailor star maps to the user’s skill level, equipment, and goals by combining user profiles with learned preferences. For beginners I emphasize bright constellations and naked-eye targets; for experienced amateurs I surface low-surface-brightness galaxies and precise finding charts. Personalization extends to display format: printable charts, planetarium-style projections, or simplified overlays for mobile stargazing apps.
I make maps more accessible to learners and outreach programs by auto-generating lesson-ready content: step-by-step observing plans, magnitude cutoffs for specific binoculars, and quizzes that reference visible constellations tonight. Machine learning also powers adaptive tutorials that adjust difficulty as a student improves. This helps educators and citizen science coordinators onboard participants quickly and keeps observers focused on meaningful targets rather than navigating outdated, generic charts.
Relevant reading on AI-driven mapping and its impact on surveying and simulation appears in articles about modern mapping platforms and large-scale stellar simulations, which show how these techniques scale from backyard stargazing to galaxy-scale research (see modern mapping platforms and AI-powered galactic simulations).
AI and Light Pollution Mapping: A New Era for Stargazing
I describe how AI pinpoints the best nights and locations for observing the Milky Way and how models blend satellite and local data to assess sky quality. Expect specific, actionable details about predictive inputs, accuracy improvements over static maps, and practical uses for astrophotography and visual observing.
Predicting Optimal Stargazing Conditions
I use machine learning to predict when and where the sky will be darkest for a given target. Models ingest satellite radiance data, recent VIIRS imagery, local SQM readings, and time-stamped light-emission changes to estimate zenith brightness and expected limiting magnitude.
The system scores sites by predicted Bortle-equivalent class for specific hours, not just by average night values. That makes planning for faint-object astrophotography practical: I can pick windows with lower sky glow and minimal artificial domes.
Predictions also factor lunar phase, moon altitude, and seasonal twilight. I set thresholds for useful observing—e.g., expected SQM > 21.5 mag/arcsec² for deep-sky imaging—and the AI issues alerts when conditions cross them.
This reduces wasted travel time and increases the chance of usable frames or resolved faint stars during a night.
Integration with Atmospheric and Environmental Data
I combine light-emission maps with real-time atmospheric inputs to refine sky-quality forecasts. Data streams include local weather models, aerosol optical depth, humidity, and cloud-cover forecasts that influence scattering and seeing.
That lets me predict both sky brightness and atmospheric transparency separately—critical for astrophotography, where transparency and seeing matter in different ways.
The AI also tracks temporary local light sources (events, construction) from high-cadence satellite passes and user reports to flag transient degradations.
Tools present results as layered visual maps (radiance, Bortle-class overlay, and SQM contours) so I can compare locations quickly. For field work I export coordinates and time windows directly to my observing app, ensuring alignment between predicted dark-sky quality and the atmospheric conditions needed for sharp, low-noise images.
Choosing the Right Tool: Use Cases and Practical Considerations
I focus on practical trade-offs so you can match tools to goals, data quality, and the environment where you’ll use maps. Consider accuracy needs, available hardware (camera or telescope), and whether you need artistic output, scientific coordinates, or live navigation.
Amateur vs. Professional Applications
I weigh accuracy, cost, and workflow when recommending tools for hobbyists versus professionals. Amateur astronomers benefit from AI apps that auto-identify stars and constellations from phone or DSLR shots, simplify plate-solving, and create shareable star maps without deep calibration. These tools save time and work well with light-polluted skies or short exposures.
Professionals require deterministic, validated outputs for publications or instrument pointing. I expect software that supports FITS files, links to catalogs like Gaia, and offers fine control over astrometric solutions. They use traditional astrometry packages or integrated pipelines in observatories to ensure reproducibility and error budgets.
Practical checklist:
- For casual use: ease of use, smartphone/DSLR support, visual overlays.
- For research: FITS support, catalog cross-referencing, exportable coordinate data.
- For both: compatibility with your telescope mount and guiding equipment.
Astrophotography and Educational Use
I recommend tools based on the goal: aesthetic prints, accurate star charts, or classroom interactivity. For astrophotography, I use stacking and registration tools to reduce noise, then either traditional mapping software or AI-assisted star extraction to label objects. Telescopes with equatorial mounts need maps that account for field rotation and precise RA/Dec coordinates.
In classrooms and planetariums, I prefer interactive maps that combine labeled constellations, mythology overlays, and quiz modes. These engage students while teaching star identification and coordinate systems. AI can generate stylized visuals for exhibits, but I require the backend to remain traceable—so educators can point to exact coordinates when needed.
Key capabilities to look for:
- Image stacking and noise reduction for photographers.
- Clear constellation labels and coordinate overlays for teaching.
- Exportable lesson assets and printable high-resolution star maps.
Space Exploration and Celestial Navigation
I prioritize determinism and provenance for mission-critical navigation and space science. Spacecraft navigation and deep-space observations need maps tied to authoritative catalogs (e.g., Gaia) and software that produces precise astrometry with uncertainty estimates. I would not rely solely on unverified generative outputs for trajectory planning.
For mission planning and on-orbit operations, I expect integration with spacecraft telemetry, telescope ephemerides, and tools that can generate star fields for sensor calibration or attitude determination. Planetary missions require specialized star catalogs that account for proper motion and parallax at mission epoch.
Operational requirements:
- Catalog-backed astrometry with error bars.
- Compatibility with spacecraft navigation toolchains.
- Ability to simulate star fields for sensor tests and attitude control.
Future Trends: The Evolving Role of AI in Mapping the Universe
I focus on concrete shifts: how AI will expand catalogs, enable public participation, and force new standards for reliability and ethics. Each trend changes how we map star formation, process large surveys, and plan missions.
Expanding Astronomical Databases with AI
I see AI handling orders-of-magnitude larger datasets from instruments like wide-field surveys and radio arrays. Automated classification models will tag galaxies, stars, and transient events in real time, reducing manual vetting for routine detections and freeing astronomers to study anomalous objects.
Machine learning will also fuse heterogeneous data — imaging, spectroscopy, and radio maps — into unified catalogs that include derived quantities (distances, metallicity estimates, morphological scores). That improves spatial and temporal mapping of star formation regions and dark-matter-influenced structures.
I expect generative models and surrogate simulators to shorten simulation times from hours on supercomputers to seconds on modest hardware. Faster simulation enables denser training sets and better uncertainty estimates for inferred parameters in large-scale structure mapping.
Collaborative Mapping and Citizen Science
I will integrate citizen scientists through AI-assisted interfaces that turn raw survey outputs into tasks humans can complete quickly. Instead of asking volunteers to label every object, AI can triage data and present borderline cases where human pattern recognition adds most value.
Platforms can combine crowd labels with model predictions using weighted consensus systems. That raises catalog completeness and reduces false positives in transient detection pipelines. It also broadens participation by lowering the technical barrier to contributing to mapping the universe.
I plan for tools that let amateur astronomers upload observations and have AI cross-match them with professional catalogs. This amplifies coverage for variable stars and near-Earth objects, and helps map localized star-formation episodes that might be missed by scheduled surveys.
Ethical and Reliability Concerns for AI Star Maps
I do not ignore risks: biased training data, domain shift between instruments, and opaque model decisions can all corrupt catalogs. If an AI misclassifies transients or misestimates distances, downstream science and mission planning suffer.
I emphasize provenance: every AI-derived entry must carry metadata about training data, model version, and estimated uncertainty. That lets users filter or reweight entries in meta-analyses and prevents silent propagation of errors.
I advocate for standardized benchmarks and periodic blind challenges to test models across instruments and sky regions. Combining those practices with human oversight and transparent uncertainty reporting will keep AI-driven star maps reliable as they grow in scope and influence.
Leave a Reply