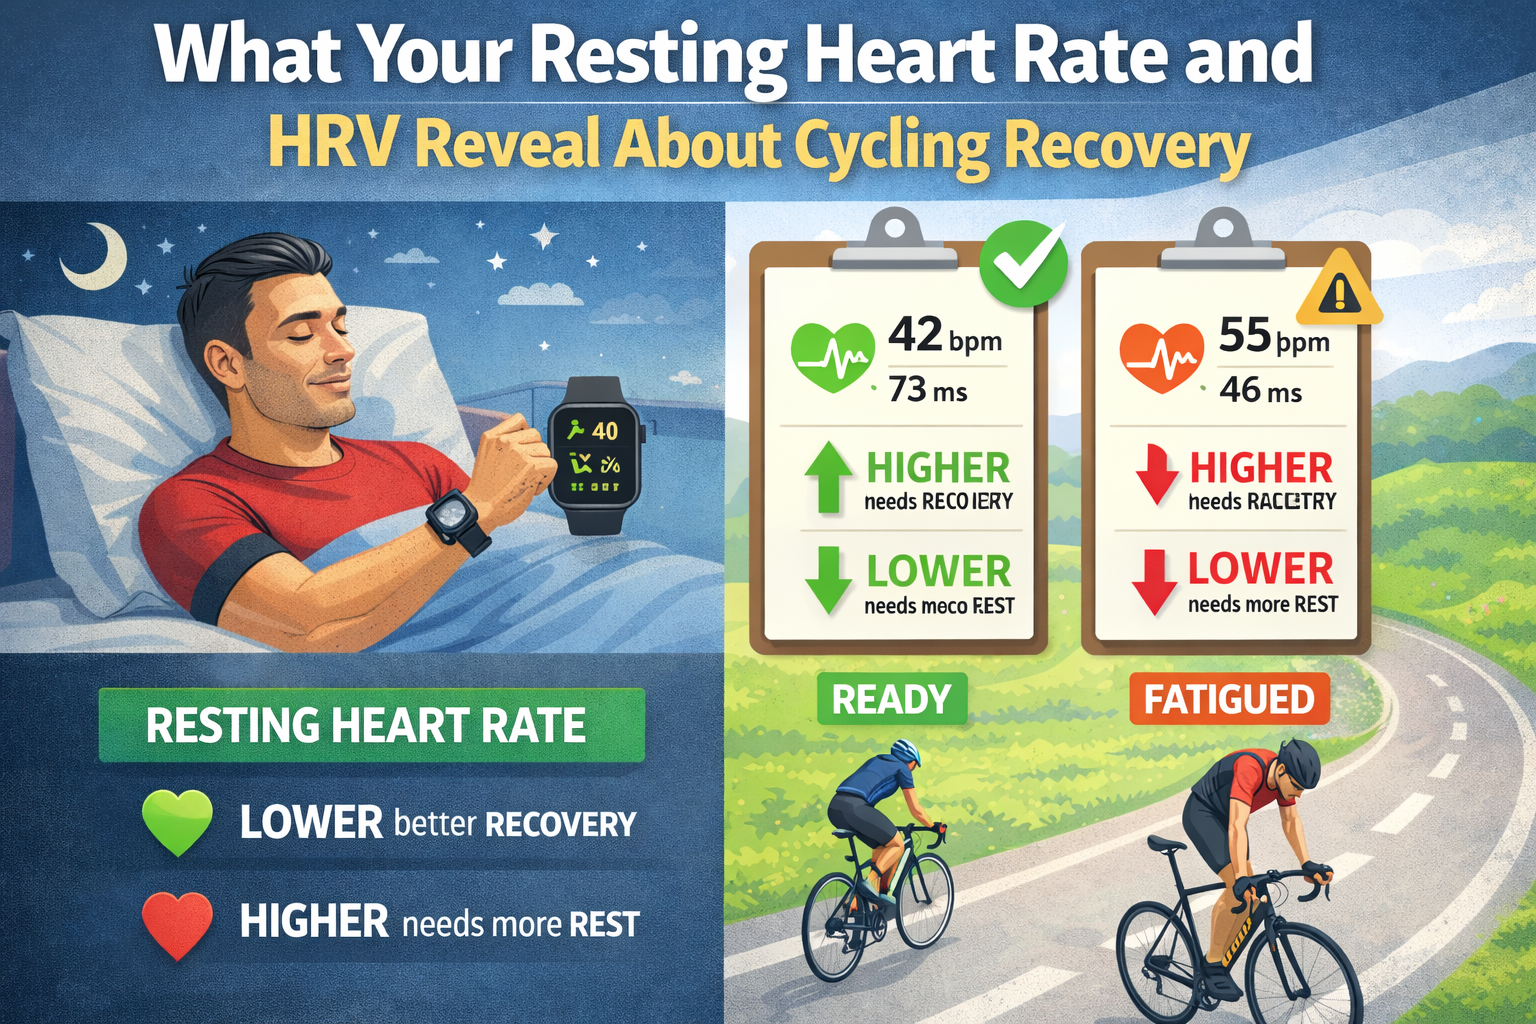
Every night while you sleep, your Apple Watch is quietly collecting the two most powerful recovery metrics in endurance sports – and every morning, you’re probably ignoring both of them.
Your resting heart rate and heart rate variability don’t just tell you how your heart is doing in some vague, general-health sense. They tell you whether today is a day to push hard on the bike, back off, or skip the ride entirely. They reveal overtraining weeks before your performance visibly declines. They confirm genuine fitness adaptation when your ride metrics are too noisy to show it clearly.
And yet, most cyclists either don’t check these numbers or – worse – check them without understanding what they actually mean.
This guide breaks down exactly what resting heart rate and HRV reveal about your cycling recovery, how to interpret trends instead of obsessing over daily snapshots, why the internet’s obsession with “good” HRV numbers is fundamentally misguided, and how correlating these passive metrics with your ride data creates a recovery picture no single metric can provide alone.

Resting Heart Rate: The Metric Hiding in Plain Sight
Resting heart rate (RHR) is your heart rate at its lowest sustained point – typically during deep sleep. Your Apple Watch captures this automatically, every single night, without you pressing a button.
Most cyclists glance at it occasionally. Few treat it as the training signal it actually is.
What Resting Heart Rate Reflects
Your RHR is driven primarily by two factors:
- Cardiac efficiency: A stronger heart pumps more blood per beat (higher stroke volume), requiring fewer beats per minute at rest
- Autonomic nervous system state: Your balance between sympathetic (“fight or flight”) and parasympathetic (“rest and digest”) nervous system activity
For cyclists, both factors are directly relevant to performance and recovery.
Typical RHR Ranges for Cyclists
| Fitness Level | Approximate RHR Range |
| Sedentary adult | 70–85 bpm |
| Moderately active | 60–72 bpm |
| Recreationally fit cyclist | 52–65 bpm |
| Well-trained endurance cyclist | 42–55 bpm |
| Elite endurance athlete | 35–45 bpm |
Important caveat: These ranges are population averages. Individual variation is enormous. A healthy, fit cyclist with a resting heart rate of 62 bpm is not less fit than one at 48 bpm – genetics, heart size, blood volume, and autonomic tone all create natural variation. Your absolute number matters far less than your personal trend.
How to Actually Use RHR for Recovery Monitoring
The value of resting heart rate isn’t in knowing your number. It’s in knowing when your number changes – and why.
The baseline principle: Establish your personal RHR baseline over 2-3 weeks of normal, consistent training. This is your reference point. Everything that follows is deviation analysis.
What RHR deviations tell you:
| RHR Change vs. Baseline | Likely Interpretation | Training Implication |
| 1-2 bpm above baseline | Normal daily variation | Train as planned |
| 3-5 bpm above baseline | Mild recovery deficit or early-stage fatigue | Reduce intensity; extend warm-up |
| 5-8 bpm above baseline | Significant under-recovery, illness onset, or accumulated fatigue | Consider rest day or very easy spin only |
| 8+ bpm above baseline | Likely illness, severe overreaching, or major life stressor | Rest. Do not train through this. |
| 1-3 bpm below baseline (sustained) | Aerobic fitness adaptation | Genuine progress signal |
| 5+ bpm below sustained baseline | Possible overtraining (parasympathetic saturation) | Paradoxical – see section below |
That last row surprises most people. An unusually low resting heart rate can actually signal a problem.
The Overtraining Paradox: When Low RHR Is a Warning Sign
Here’s something most fitness content won’t tell you: in cases of advanced overtraining, resting heart rate can drop below your normal baseline rather than rise above it.
This happens through a phenomenon called parasympathetic saturation – your autonomic nervous system essentially becomes stuck in a suppressed state after weeks or months of accumulated overload. Your body isn’t recovering efficiently; it’s shutting down non-essential outputs.
How to distinguish genuine fitness adaptation from parasympathetic saturation:
| Signal | Fitness Adaptation | Overtraining Suppression |
| RHR trend | Gradual decline over weeks/months | Sudden drop after heavy training block |
| Ride performance | Maintained or improving | Declining despite consistent training |
| Perceived effort | Normal or lower for given output | Everything feels harder than it should |
| Motivation | Normal | Significantly reduced |
| Sleep quality | Normal or improved | Disrupted despite fatigue |
If your resting heart rate drops and your performance also drops – or if easy efforts feel disproportionately hard – don’t celebrate the low number. Investigate it.
RHR and Illness Detection
One of the Apple Watch’s most practically valuable features for cyclists is early illness detection through RHR tracking.
Your resting heart rate typically elevates 24-48 hours before you feel noticeably sick. That sore throat you woke up with on Wednesday? Your RHR probably ticked up on Monday night.
Practical protocol:
- Check your overnight RHR every morning (Apple Health → Heart → Resting Heart Rate)
- If it’s 5+ bpm above your baseline with no obvious training explanation, treat the next 48 hours as precautionary recovery
- Training while fighting off an infection doesn’t just delay recovery from the illness – it delays recovery from your training, compounding the damage
Many cyclists have avoided weeks of compromised training by catching a 6 bpm RHR elevation early and resting for two days instead of pushing through and getting properly sick for ten.
Heart Rate Variability: The Most Misunderstood Metric in Cycling
If resting heart rate is the metric cyclists ignore, HRV is the one they misinterpret.
Heart rate variability has exploded in popularity over the past few years, fueled by wearable technology and a flood of content claiming it’s the ultimate recovery metric. Much of that content is oversimplified or outright wrong.
Let’s start from the ground up.
What HRV Actually Is
Your heart doesn’t beat like a metronome. Even at a resting heart rate of 60 bpm – one beat per second on average – the actual intervals between beats vary slightly. One gap might be 0.95 seconds, the next 1.07 seconds, the next 0.98 seconds.
Heart rate variability measures these beat-to-beat fluctuations.
Higher HRV = more variation between beats = generally indicates a relaxed, recovered, parasympathetically-dominant state
Lower HRV = less variation between beats = generally indicates a stressed, fatigued, or sympathetically-dominant state
That’s the core concept. Where things get complicated – and where most cycling content goes wrong – is in the interpretation.
How Apple Watch Measures HRV
Apple Watch records HRV using the SDNN method (Standard Deviation of NN intervals). Specifically, it captures HRV:
- During overnight periods while you sleep
- During periodic background readings throughout the day
- The values displayed in Apple Health are primarily from overnight or resting measurements
SDNN captures overall variability across all frequency bands of heart rhythm fluctuation. This is different from rMSSD (Root Mean Square of Successive Differences), which some other platforms use and which specifically isolates parasympathetic nervous system activity.
Why this matters: if you’re comparing your Apple Watch HRV to numbers from a Garmin, Whoop, or Oura Ring, you may be comparing different mathematical calculations of different measurement windows. The numbers won’t – and shouldn’t – match directly.
The Myth of “Good” HRV Numbers
This is where the internet fails cyclists spectacularly.
Search “good HRV for athletes” and you’ll find:
- “An HRV above 60 ms indicates good recovery”
- “Elite athletes typically have HRV of 80-120 ms”
- “If your HRV is below 50, you’re stressed or overtrained”
Every single one of these statements is misleading at best, harmful at worst.
Here’s why:
Individual HRV variation is massive. A perfectly healthy, well-recovered 45-year-old cyclist might have a baseline HRV of 28 ms. A 25-year-old recreational rider might sit at 85 ms. Neither number tells you anything about their relative fitness or recovery status.
What determines your baseline HRV:
| Factor | Impact on HRV |
| Age | HRV declines naturally with age – roughly 1-2 ms per year after 25 |
| Genetics | Accounts for up to 50% of individual HRV variation |
| Sex | Males tend to have slightly higher SDNN values on average |
| Body composition | Higher fitness generally correlates with higher HRV, but individual variation swamps this effect |
| Autonomic nervous system wiring | Some people are naturally parasympathetically dominant; others aren’t |
A cyclist with a baseline HRV of 32 ms who sees a reading of 38 ms after a rest day is showing a stronger recovery signal than a cyclist with a baseline of 80 ms who reads 74 ms after a hard training week. The absolute numbers are irrelevant. The deviation from personal baseline is everything.
Stop comparing your HRV to anyone else’s. Start comparing today’s HRV to your own 30-day rolling average.
What HRV Trends Actually Reveal for Cyclists
Once you’ve abandoned the pursuit of an arbitrary “good” number and established your personal baseline, HRV becomes genuinely powerful.
Acute HRV changes (day to day):
| HRV Change vs. Your Baseline | Probable Interpretation |
| 5-10% above baseline | Well-recovered; body is in a parasympathetic state; good day for intensity |
| Within ±5% of baseline | Normal variation; train as planned |
| 5-15% below baseline | Accumulated fatigue, poor sleep, or moderate stress; favor endurance over intensity |
| 15-25% below baseline | Significant recovery deficit; easy riding or rest recommended |
| 25%+ below baseline | Major stressor present (illness, severe under-recovery, emotional stress); rest strongly advised |
Important nuance: A single low HRV reading is often meaningless. Alcohol the night before, a late meal, poor sleep position, or even a vivid dream can suppress a single night’s reading without reflecting any actual recovery deficit.
The three-day rule: Don’t react to a single HRV reading. If your HRV is suppressed for three consecutive days, something real is happening – fatigue, developing illness, accumulated life stress, or genuine overreaching. At that point, adjusting training is warranted.
Chronic HRV Trends (Weeks to Months)
This is where HRV shines for cyclists tracking fitness across a season.
A rising HRV baseline over weeks or months – meaning your 30-day rolling average is gradually increasing – is one of the strongest signals of genuine aerobic adaptation. Your autonomic nervous system is handling training load more efficiently, parasympathetic recovery is strengthening, and your cardiovascular system is adapting.
A declining HRV baseline – a gradually dropping 30-day average despite consistent or increasing training – is an early warning of overreaching. This signal often appears 2-4 weeks before your on-bike performance visibly declines.
A stable HRV baseline with increasing training load indicates your body is absorbing the work. This is the ideal scenario during a build phase: you’re doing more, and your recovery system is keeping up.
| HRV Baseline Trend | Training Load Trend | Interpretation |
| Rising | Stable or moderate increase | Positive adaptation – fitness improving |
| Stable | Increasing | Absorbing training load – appropriate progression |
| Stable | Stable | Maintenance phase – no new stimulus |
| Declining | Increasing | Overreaching – reduce volume or intensity |
| Declining | Stable | Non-training stressor (sleep, life stress, illness) or accumulated fatigue |
| Declining | Decreasing | Recovery in progress but incomplete – continue rest protocol |
Correlating Recovery Metrics With Ride Performance
Here’s where resting heart rate and HRV stop being abstract health metrics and start becoming cycling performance tools.
The principle is straightforward: your overnight recovery metrics predict the quality of your next-day ride performance – if you know how to read them.
The Recovery-Performance Connection
Consider two rides on the same route, two weeks apart:
Ride A:
- Previous night RHR: 3 bpm above baseline
- Previous night HRV: 12% below baseline
- Ride result: Average HR 148 bpm, average speed 26.8 km/h, EF 1.81
Ride B:
- Previous night RHR: 1 bpm below baseline
- Previous night HRV: 8% above baseline
- Ride result: Average HR 139 bpm, average speed 28.4 km/h, EF 2.04
Same rider. Same route. Similar conditions. Drastically different performance – entirely predictable from the recovery data.
On Ride A, the cyclist was under-recovered. Their body compensated by working harder (higher HR) for less output (lower speed). The Efficiency Factor tells the story: 1.81 versus 2.04 represents a substantial difference in how much speed each heartbeat produced.
On Ride B, full recovery meant the cardiovascular system operated at a lower cost for higher output. This isn’t the cyclist being “more motivated.” It’s physiology. Recovered systems perform better. Every time.
Why This Correlation Matters for Training Decisions
Most cyclists make training decisions based on a schedule or on how they feel standing in their kitchen at 6 AM. Both are unreliable.
A schedule doesn’t account for the fact that Tuesday’s “easy ride” actually stressed your body more than expected because you slept poorly Sunday and Monday nights. And subjective feeling is notoriously misleading – many cyclists feel “fine” in the early stages of overreaching, only to crack mid-ride.
Recovery metrics provide an objective pre-ride signal:
| Pre-Ride Recovery State | Recommended Session Type |
| RHR at/below baseline + HRV at/above baseline | High-intensity intervals, race-pace efforts, hard group rides |
| RHR at baseline + HRV slightly below baseline | Moderate tempo work, steady-state endurance |
| RHR 3-5 above baseline + HRV 10-15% below | Easy endurance spin only – keep HR in Zone 1-2 |
| RHR 5+ above baseline + HRV 15%+ below | Active recovery or complete rest – hard riding today will cost you more than it gives you |
This isn’t about being fragile or avoiding hard work. It’s about timing your hard work for days when your body can actually absorb and adapt to the stress. Pushing hard on a day when your recovery metrics are suppressed doesn’t make you tougher – it makes the next three days of training worse.
The best training isn’t the hardest training. It’s the best-timed training.
Building a Personal Recovery-Performance Model
Over time, tracking the relationship between your overnight recovery metrics and your next-day ride quality creates something immensely valuable: a personal recovery-performance model.
After 20-30 rides where you’ve noted your pre-ride RHR and HRV alongside your ride’s Efficiency Factor, HR drift, and perceived effort, patterns emerge that are specific to your physiology:
- You might discover that your performance only degrades meaningfully when HRV drops more than 18% below baseline – anything less is noise for your body
- You might find that RHR is a more reliable predictor of your ride quality than HRV
- You might notice that a single night of suppressed metrics doesn’t affect you, but two consecutive nights does
- You might learn that your HRV recovers faster from high-intensity work than from long endurance rides – or vice versa
These patterns are individual. No article, no coach, and no algorithm can tell you your personal thresholds in advance. They emerge from your own data.
The Myths That Won’t Die
Let’s address the most persistent misconceptions about RHR and HRV in cycling, because bad information leads to bad decisions.
Myth 1: “Lower Resting Heart Rate Is Always Better”
Reality: Within the normal range for your fitness level, a lower RHR generally indicates greater cardiac efficiency. But below a certain point – which varies individually – an extremely low RHR can indicate bradycardia (pathologically slow heart rate), overtraining-induced parasympathetic saturation, or other medical conditions.
If your RHR suddenly drops 8-10 bpm below your established baseline and stays there, that’s not a fitness breakthrough. Consult a physician.
Myth 2: “You Should Check HRV First Thing Every Morning”
Reality: Morning HRV readings taken immediately upon waking while still lying down are the clinical gold standard – for research protocols with chest-strap monitors in controlled conditions.
Your Apple Watch measures HRV overnight, automatically, while you sleep. These readings are arguably more consistent than morning readings because they’re not influenced by your alarm, the act of waking, bladder urgency, or the immediate stress of remembering you have an early meeting.
Use your Apple Watch’s overnight HRV. Don’t add a manual morning protocol unless you have a specific reason and a consistent methodology.
Myth 3: “High HRV Means You Should Train Hard Today”
Reality: High HRV indicates parasympathetic dominance and general recovery. It does not guarantee performance readiness.
You can have excellent HRV and still be:
- Glycogen depleted from yesterday’s long ride
- Dehydrated
- Dealing with muscle damage that hasn’t manifested as systemic stress yet
- Psychologically fatigued
HRV is one input into the readiness equation. Treat it as a necessary condition for hard training, not a sufficient one.
Myth 4: “HRV Apps That Give You a Daily Score Are Accurate”
Reality: Many apps convert your raw HRV into a proprietary “recovery score” or “readiness score” from 1-100. These scores are algorithmic interpretations that layer assumptions on top of your data.
The problems:
- Different apps produce different scores from identical HRV data
- The algorithms behind these scores are rarely transparent
- The scoring systems are designed for broad populations, not your individual physiology
Raw HRV trend relative to your personal baseline is more informative than any derived score. If you understand what a 15% deviation from your 30-day average means, you don’t need an app to tell you whether it’s a “green” or “red” day.
Myth 5: “Young Athletes Should Have HRV Above 80 ms”
Reality: As discussed above, individual variation makes absolute thresholds meaningless. A 22-year-old competitive cyclist with a genetic predisposition toward lower HRV might baseline at 45 ms and be in perfect health and peak fitness.
Telling that athlete they’re “stressed” because their number is below 80 would be absurd – and might lead them to unnecessary rest or, worse, anxiety about a non-existent problem.
Your HRV number is only meaningful relative to your own history. Period.
Practical Protocol: Using RHR and HRV for Cycling Recovery
Here’s a concrete, actionable system for integrating recovery metrics into your cycling:
Daily (30 Seconds)
- Check your overnight RHR in Apple Health
- Check your overnight HRV in Apple Health
- Mentally note where both sit relative to your baseline
- Adjust today’s planned ride intensity if either metric is significantly suppressed
Weekly (5 Minutes)
- Review your 7-day RHR trend – is it stable, rising, or falling?
- Review your 7-day HRV trend – same question
- Cross-reference with your training volume that week
- If HRV has been declining across the week while training load was moderate or heavy, your next week should include more recovery
Monthly (15 Minutes)
- Assess your 30-day RHR rolling average versus the previous 30 days
- Assess your 30-day HRV rolling average versus the previous 30 days
- Correlate with your ride performance trends – has EF been rising, stable, or dropping?
- Identify whether your current training load is producing adaptation (improving metrics), maintenance (stable metrics), or overreaching (declining metrics)
Seasonal (30 Minutes)
- Look at 3-6 month RHR and HRV trends
- Identify your peak recovery periods and your lowest recovery points
- Cross-reference with your best and worst ride performances
- Use these patterns to plan future training blocks – scheduling your hardest weeks when historical data shows your recovery capacity is highest
The Missing Link: Automated Recovery-Performance Correlation
Everything described in this guide is technically possible to do manually. Check Apple Health daily, maintain a spreadsheet, log your pre-ride recovery state alongside your post-ride metrics, and build your own trend analysis over months.
In practice, almost nobody does this consistently. Life intervenes. The spreadsheet goes stale. Two weeks of missed logging destroys your data continuity.
This is exactly the kind of correlation that automated analysis is built for.
Future versions of the Apple Health Cycling Analyzer will integrate resting heart rate and HRV data with ride performance analysis – automatically correlating your overnight recovery metrics with next-ride Efficiency Factor, HR drift, and performance assessments. The goal: a unified view that connects how you recovered with how you performed, identifying your personal recovery thresholds and optimal training timing without manual tracking.
In the meantime, the current analyzer already processes your ride data into structured performance trends – Efficiency Factor tracking, HR drift analysis, VAM computation, and rolling baseline comparisons. Combining these ride-level insights with your own daily awareness of RHR and HRV trends gets you 80% of the way to intelligent, recovery-informed training decisions.
The Bottom Line
Your Apple Watch captures two metrics every night that most dedicated cycling computers can’t touch: resting heart rate and heart rate variability. Together, they form a passive, continuous window into your recovery state – no chest straps, no morning routines, no manual logging required.
But these metrics only become useful when you understand three things:
- Your personal baseline matters infinitely more than absolute numbers. Stop comparing yourself to tables on the internet. Start comparing yourself to your own 30-day trend.
- Trends over days and weeks are signal. Single readings are noise. React to three consecutive suppressed readings, not one bad night.
- Recovery metrics predict ride quality. The connection between last night’s HRV and today’s Efficiency Factor is real, measurable, and – once you’ve seen it in your own data – impossible to ignore.
Your Apple Watch is already doing the work. Every night, while you sleep, it’s measuring the two variables that determine whether tomorrow’s ride builds fitness or digs a recovery hole.
All you have to do is pay attention.
Leave a Reply